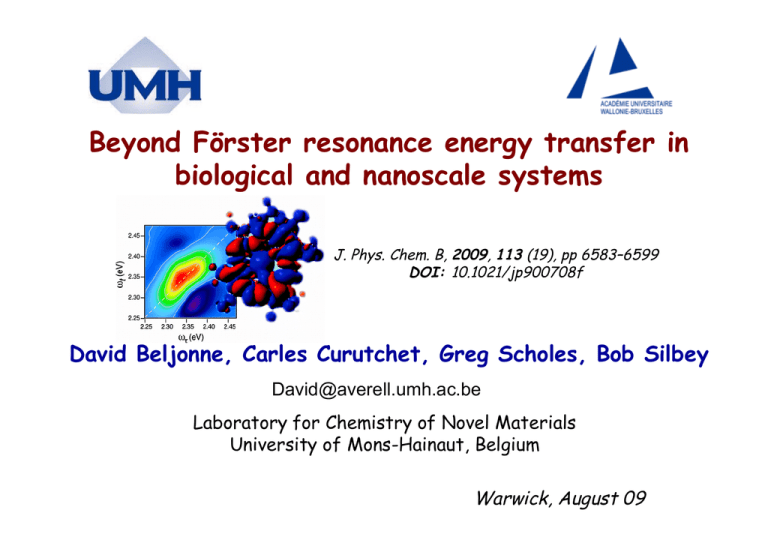
Beyond Förster resonance energy transfer in biological and nanoscale systems
advertisement

Beyond Förster resonance energy transfer in biological and nanoscale systems J. Phys. Chem. B, 2009, 113 (19), pp 6583–6599 DOI: 10.1021/jp900708f David Beljonne, Carles Curutchet, Greg Scholes, Bob Silbey David@averell.umh.ac.be Laboratory for Chemistry of Novel Materials University of Mons-Hainaut, Belgium Warwick, August 09 Taking Advantage of Excitation Diffusion in Conjugated Polymers Based... ... displays ... solar cells 15 x 10 cm, 300 dpi, 1 MB Photo: Philips Color purity h+ e- Charge generation Al ITO Al ITO University of Linz ... (bio)chemical sensors CH3 NO2 NO2 NO2 TNT LUMO LUMO HOMO HOMO Polymer Swager and co., MIT Polymer + TNT Förster Resonant Energy Transfer (FRET) Resonant Energy Transfer (RET) D* A* kda hn D Virtual Photon exchange A D=donor, high-energy chromophore A=acceptor, low-energy chromophore Förster Resonant Energy Transfer (FRET) Fermi Golden Rule 2 k FRET Vdd = point dipole-point dipole interaction 2Vdd Qi Qf sVdd 2 J J Spectral Overlap Förster Resonant Energy Transfer (FRET) 1 R0 2 2 0 sVdd J D R 6 kFRET 2 0 9000 (ln 10 ) D 6 4 R0 I ( ) ( ) d D A 5 4 128 N A n 0 Energy transfer efficiency: T 1 R 6 1 ( ) R0 FRET = ‘Spectroscopic Ruler’ Beyond Förster Resonant Energy Transfer RET • Electronic coupling poorly described by point dipole approximation • Screening by the environment: s 1/n2 • Shared vibrational modes GRET • Energy transfer between weakly interacting aggregates CRET • Intermediate coupling & coherences Point Dipole and Transition Densities Vmn Transition density approach m* Vmn Z a i a ia m m mim m D m ia n i ,a j ,b m n Z Z ia j b 2 bm jm | anin - bnim | am jn P 2 J K P Rmn lm, ln Rmn > lm, ln TDM PDM Rmn µm Vmn 1 4 0 m (i ) n ( j ) rij i j m n Vmn 1 m3 n 4 0 Rmn µn ˆ m ˆ n 3( ˆ m Rˆ mn )(ˆ n Rˆ mn ) Transition density approach: Wiesenhofer et al., Adv. Funct. Mat. 15, 155 (2005) ; Beljonne et al., J. Chem. Phys. 112, 4749 (2000); see also Scholes, Rossky, Barford… Line dipole model: Sundström, Pullerits and co Examples of transitions densities calculated using quantum-chemical methods. A transition density, defined as eg e g , represents the superposition state of ground (g) and excited (e) states. Note how they follow the shape of the chromophore in each case. (a) A bis-perylene derivative. (b) Tryptophan. (c) A bilin from cryptophyte photosynthetic antenna systems. (d) The S2 state of a carotenoid from the LH2 complex of a purple bacterium. Breakdown of the Point Dipole Approximation S1 Sn Z S0 Y OPVn C60 X S1-S0 (~14D; x-polarized) S0-S9 (~0.1D) S0-S15 (~0.6D) z-polarized S0-S25 (~0.6D) xy-polarized) Breakdown of the Point Dipole Approximation kRET (1012s-1) Dyad Calculateda Experimentb OPV2–MPC60 6.6 (1.1) 2.9 OPV3–MPC60 2.3 (0.3) 2.1 OPV4–MPC60 0.5 (0.1) 1.1 Calculated and measured energy transfer rates (kRET) in OPVn-MPC60 dyads. The numbers in between parentheses correspond to the Förster rates and the point dipole approximation. PDA in Nanoscale Systems Squared electronic couplings predicted by the point-dipole model (circles) and by a multicentric transition density approach (triangles) as a function of the donor-acceptor center-to-center separtation. (a) Two 3.9 nm diameter wurtzite CdSe quantum dots aligned parallel with respect to their crystallographic c-axis. (b) Two parallel (7,5) semiconducting single wall carbon nanotubes. Through-Space versus Through-Bond Coupling ACCEPTOR DONOR IEFPCM reaction potential, with implicit and explicit solvent effects Solvent Screening Effects s A exp( R) s0 The molecule’s transition density polarizes the surrounding solvent through the interaction with the electric field indicated. This three-dimensional polarization can be represented as effective solvent charges collected on a surface enclosing the molecules, plotted on the right-hand-side. Solvent screening factors, s, predicted for various chromophore pairs of lightharvesting antennae proteins. The Förster value, 1/n2, is indicated by the lower horizontal line, and the Onsager value, 3/(2n2+1), is the upper line. Spectral Overlap and the Structure of the ‘Bath’ 0 1 0 f D t =exp g D D f A t =exp g A A 2 1 Quantum-chemical calculations of ground-state and excitedstate geometries + normal mode decomposition: 2 emission absorption Energy Jmn Displaced (an)harmonic oscillator model g Q2 2 Electron-phonon coupling g2 Reorganization energy Ql 1 exp g D D 1 exp g A A 2n 2 D 2 2n A 2 2 n D exp i t n 1 exp i t D D 1 exp i A t exp i t n n A A A D Spectral Overlap and the Structure of the ‘Bath’ kDA |VDA |2 00 D A 2 Re dt expi DA t exp g g 2n( ) 1 D A 2 exp g g n( )exp(i t) n( ) 1exp(i t) Separate baths for donor and acceptor (Förster) For each l, either glD or glA = 0: k DA 2 ~ 00 ~ 2 VDA Re d FA ( DA )FD ( ) 2 2 VDA J Spectral Overlap Spectral Overlap and the Structure of the ‘Bath’ Shared vibrational modes: A Marcus-like picture J NF Re dt exp(i 0 0 DA t) f A (t) f D (t) f DA (t) 1 2 d d F̃ ( 1 2 00 DA 0 0 1 ) F̃D ( DA 2 ) F̃DA () (a) Same sign displacements l < lD + lA A (b) Opposite sign displacements l > lD + lA Continuous distribution of low-frequency vibrational modes (Gaussian lineshape) Förster 0 0 D 2 A 2 ( g ) ( g ) DA 2 exp D 2 A 2 D 2 A 2 2 ( g ) ( g ) 2n ( ) 1 ( g ) ( g ) 2n ( ) 1 J F GB Non-Förster 0 0 D A 2 ( g g ) DA 2 exp D A 2 D A 2 2 ( g g ) 2n ( ) 1 ( g g ) 2n ( ) 1 J NF GB Continuous distribution of low-frequency vibrational modes (Gaussian lineshape) Förster Non-Förster: sgn (gD)= sgn (gA) Non-Förster: sgn (gD)= - sgn (gA) 14000 A D g =1.0; |g |=2.0 12000 Overlap -1 max(cm ) 10000 A D g =1.0; |g |=1.6 8000 6000 4000 A D g =1.0; |g |=1.2 2000 0 -2000 0 2000 4000 6000 8000 10000 DA(cm-1) Envelope of the effective spectral overlap as a function of the D-A electronic for different values and signs of the electron-phonon couplings. The tick line is the Förster result. The thin and dashed lines correspond to displacements with opposite and same signs, respectively. T=300 K and wl=400 cm-1. 0 1 2 3 D g 4 5 6 D-A electronic gap maximizing the spectral overlap factor as a function of the excitation-phonon coupling on the donor in the case of: (i) Independent modes (Förster case, thick line); (ii) one single nonlocal vibrational mode (non-Förster case, with opposite-sign displacements, thin line); (iii) same as (ii) for same-sign displacements (dashed line). wl=400 cm-1 and T=300K. Energy Diffusion in the Weak Coupling Regime Weak Coupling Regime Fermi Golden Rule d Pm t = dt k nm P t - knm Pn t + Pm m1 mn m Pauli Master Equations (PME) Monte Carlo simulations k mn 2 2 Vmn J mn Spectral Overlap Homogeneous and Inhomogeneous Disorder In mutichromophoric donor-acceptor systems, we must calculate spectral overlaps using homogeneous line broadening and then average the electronic coupling–spectral overlap function over static disorder! (a) Experimental absorption spectrum of the LH2 lightharvesting complex isolated from the purple bacterium Rps. acidophila (room temperature). The B800 and B850 bands are labeled. (b) Calculated absorption spectra of the B850 ring only for individual LH2 complex (77 K). Notice that each complex is different. (c) Views of the LH2 structure. The 18 bacteriochlorophyll-a molecules that comprise the B850 ring are colored pink, while the 9 in the B800 ring are blue. The carotenoids (rhodopin glucoside) are colored gray. GFT + proper averaging over disorder Calculated distributions of rates, i.e., calculated for each LH2 complex in an ensemble. The red curve is the FRET distribution. The blue curve shows the calculations of Jang, et al. using a version of GFT Modeling transport with Gaussian disorder d dt atomistic Förster and PME Pm t = - kmn Pm t - knm Pn t + Pm t m1 nm k mn Coarse graining z 2 2 Vmn J mn Miller-Abraham and MC E E 6 1 rF exp , E , E , r kT r 1, r u ( E , E , r ) 6 ln rF x E E E E (E E) kT Equilibrium transport D 3D lattice continuum 1 1 r 2 exp u r 2 6 6 2 g ( E ) exp( E / kT ) exp( u ( E ))dE 3 lD D rF g ( E ) exp( E / kT ) E2 Nt g E exp 2 s 2 2s 1/ 2 Exciton diffusion length Evguenia Emelianova, Stavros Athanasopoulos, Phys. Rev. B, in press Molecular Aggregates as Donors and Acceptors 1 2 / 2 ( 1 2 ) / 2 0 ( 1 2 ) / 2 2 ; Ag Vdd Dg ; Ae 1;Ag Vdd Dg ; Ae 2 ; Ag Vdd Dg ; Ae / 2 V=0 V0! (a) Illustration of an aggregate donor–acceptor system. Strong coupling within each of the donor and acceptor groups forms molecular exciton states that are the effective donor and acceptor states in GRET. (b) Depiction of the model dimer system discussed in the text. (c) Transition densities calculated for the upper P+ and lower P– exciton states of the special pair dimer in the photosynthetic reaction center of the purple bacterium Rhodobacter sphaeroides. Weak coupling: Vmn~10-40 cm-1 Excitonic couplings and transport regime in molecular crystals: The acenes J-aggregate ‘Hopping between layers’ Strong coupling: Vmn~100-300cm-1 Evguenia Emelianova Energy transport in oligoacenes E Layer 1 Layer 2 Boltzmann RET multiple pathways (k=0 0 for N ) 13 10 Partial cancellation at short d 12 Rate of energy transfer, s -1 10 11 10 10 10 9 10 8 10 Distance between layers, A T=300 K 11,46 15 20 30 50 100 7 10 6 10 1 10 100 N, number of molecules in the layer 1000 Dipole-dipole at large d Energy transport in oligoacenes 6 13 10 4 3 12 10 2 10 100 11 10 Number of molecules -1 1 RET, s Exponent 5 1/d3-4 10 10 9 10 1/d6 8 10 7 10 Number of molecules in the layers 1 4 12 40 80 176 260 416 800 PBC 6 10 0,01 0,1 inverse distance between layers, A -1 Energy transport: Role of dimensionality k ET 1 d 0n dn d0= critical distance (Förster radius for n=6) d 1/d6 1/d4 1/d3 Hill et al., Phys. Rev. B 69, 041303 (2004); H. Kuhn, J. Chem. Phys. 53, 101 (1970); Shaw et al., Phys. Rev. B 78, 245201 (2008); Scully et al., Adv. Mater. 19, 2961 (2007) Energy transport in oligoacenes 2 Random walk: LD D k RET r 1000 950 900 Delocalization inplane increases Ld out-of-plane by a factor ~2-3 850 anthracene Diffusion length, A 800 750 700 650 600 pentacene 550 500 450 T=300 K Distance between layers, A 11,46 15 20 400 350 300 Requires coherent domains of 10-100 molecules 250 200 1 10 100 N, number of molecules k ET 1d d 6 0 6 anthracene d0=R0= 4,2nm k ET 1 d 03 3 d d0= 90nm Energy Diffusion in the Strong Coupling Regime Vmn Enn Exciton states: Polaron transformation: Pauli Master equations: Pereverzev, Bittner, JCP 125, 104906, 2007 Delocalization in Conjugated Polymers Polyfluorenes thin films Laura Herz, PRL 98, 027402, 2007 MEH-PPV, diluted solutions Greg Scholes, Toronto Modeling MEH-PPV Single Chains Random growth algorithm chromophores Exciton matrix Gil Claudio and Eric Bittner University of Houston S1,S1 E1,S V 0 1, 2 1 Site VS21,,S11 E 2,S 1 energy Electronic coupling E1,Sn Sn,Sn V 2,1 VS11,Sn ,2 VSn,Sn 1, 2 E 2,Sn Polarization Anisotropy Decay Eigenstate representation Site representation Smaller radius of gyration Short time scale (~10ps): fast, short-range energy transfer Long time scale (~200ps): slow, long-distance hopping Bittner et al., in preparation Intermediate Coupling and Coherent Dynamics h /V >> tdecoh h /V << tdecoh Weak coupling Strong coupling The time-dependent population density of the electronically excited acceptor state, |a>, evolves in time after initial preparation of |d> according to: a (t) Tr d V (t ) a aV ( t ) d d i t V (t ) expT H (t )dt 0 Intermediate Coupling and Coherent Dynamics Calculations of the evolution of acceptor population density as a function of time after photo-excitation of the donor. U is the electronic coupling between donor and acceptor. The line width parameter is related to the decoherence time via g = /tc. A linear relationship between acceptor population and time indicates the validity of the Fermi golden rule expression for RET. Excitation Delocalization in OPV Chiral Stacks Dodecane solutions at T<Tm Left helices for 4R enantiomer Rotation angle <f>~-14° (Dreiding) Hoeben et al., Angew. Chem. 43, 1976 (2004) Holstein Model normal mode frequency normal mode displacement (l2~S) H 0 bn† bn 0 (bn† bn ) | n n | n vibration m n vibronic 2 ( D J ) | m n | 0 mn n mn 00 n electronic coupling electronic molecular basis diagonal disorder Absorption, PL, CD and CPL Spectra Weak coupling limit angle = -14° s=0.12 eV, l0~4.5 Absorption, PL, CD and CPL Spectra Abn, CD angle = -14° PL, CPL s=0.12 eV and l0=4.5 Coherent Exciton Size Nuclear distortion field Ncoh ~ 2-3 units Exciton coherence function Electronic Excitations in OPV Chiral Stacks: A Simplified Picture Ninc~50 Disorder : l0=4.5 EV coupling: Ncoh~2 t<1ps Vertical excitation, no disorder Thermalized excitation, disorder Spano et al. JACS 129, 7044 (2007) Jean-Luc Brédas, Jérôme Cornil, Evguenia Emelianova, Johannes Gierschner, Emmanuelle Hennebicq, Jasper Knoester, Benedetta Mennucci, Frank Spano, Bernard Van Averbeke, Alison Walker Overdamped Brownian + Discrete Oscillators Interchain Delocalization in Conjugated Polymers MEH-PPV, diluted solution Tieneke Dykstra & Greg Scholes, Toronto Probing Interchain Delocalization in MEH-PPV Inter-chromophore delocalization TDM rotation PR angle (°) 40 1.6 30 1.4 20 1.2 1.0 10 0.8 0 22000 24000 24000 26000 26000 28000 28000 30000 30000 32000 32000 34000 34000 36000 36000 22000 -1 Energy (cm -1)) Energy (cm Probing Interchain Delocalization in MEH-PPV TDM rotation angle of ~17° (anisotropy~0.35) due to self-trapping: Localization alone not enough to explain anisotropy data Modeling Absorption, PL and Dynamics Absorption and emission lineshapes Spectral diffusion Exciton states: Master equations: Overlap probability Spectral density Didraga et al. JPCB, 110, 18818 (2006) Absorption and PL Polarization Anisotropy Decay R=154 A R=154 A Excitonic Couplings and Transport Regime in CP Amorphous Cristalline Hopping Wave-like Hopping !!! J k k ,1 V k , 2 where 1 e ik p p ,1 N P 1 ik q k ,1 e q ,1 N q 1 1 J k e ik ( p q ) p ,1 V q , 2 N p ,q N k ,1 eikl ) p,1 V p l ,2 p ,q ˆ ˆ Positive interactions and 3( negative R )( R ) J e cancel out in Rthe infinite chain limit ikl k l 1 2 1 l 3 l 2 l 1 2 12 2 l e 2 2 3/ 2 3l 2 2 5/ 2 l d l d that can be rewritten after continuum approximation ikl 2 1 1 l2 ikl cos J k 1 2 dl d 3 2 2 5/ 2 l 2 d 2 3/ 2 2 A 0 0 l d 0 for k 0 Excitation Delocalization in OPV Chiral Stacks Dodecane solutions at T<Tm Left helices for 4R enantiomer Rotation angle <f>~-14° (Dreiding) Hoeben et al., Angew. Chem. 43, 1976 (2004) Building up the Hamiltonian normal mode frequency normal mode displacement (g2~S) H bn† bn g (bn† bn ) | n n | n vibration m n vibronic 2 ( D V ) | m n | g mn n mn 00 n electronic coupling electronic molecular basis diagonal disorder ! Identification of ‘chromophores’ in CP ! Absorption, PL, CD and CPL Spectra Weak coupling limit angle = -14° s=0.12 eV, l0~4.5 Absorption, PL, CD and CPL Spectra Abn, CD angle = -14° PL, CPL s=0.12 eV and l0=4.5 Coherent Exciton Size Nuclear distortion field Ncoh ~ 2-3 units Exciton coherence function Electronic Excitations in OPV Chiral Stacks: A Simplified Picture Ninc~50 Disorder : l0=4.5 EV coupling: Ncoh~2 t<1ps Vertical excitation, no disorder Thermalized excitation, disorder Spano et al. JACS 129, 7044 (2007) Generating Morphologies Single pentacene crystals Discotic liquid crystals Force Field Molecular Dynamics Polymer chains (isolated, solution, bulk) Generating Morphologies Polymer Random Growth Algorithm O O O O Quantum-chemical potential energy (bending, torsion, etc) Keep track of the atomic details Through-Space versus Through-Bond Coupling f GS 400 TB+TS E(cm-1) 300 ES 200 100 acceptor-acceptor donor-donor donor-acceptor TB sensitive to confinement effects mostly TS 0 0 10 20 30 40 (°) 50 60 70 80 90 Through-Space versus Through-Bond Coupling 8 400 acceptor-acceptor donor-donor 200 CT character (%) TB+TS 4-state model -1 E(cm ) 300 1st ES, acceptor-acceptor 1st ES, donor-donor 7 100 mostly TS 6 TB+TS 5 4 3 mostly TS 2 1 0 0 0 10 20 E1* V12 H t t 30 40 50 (°) 60 t * E2 t t 1 2 t ECT 0 2 1 t 0 ECT 70 80 90 V12 t t t0 cos( ) 0 10 20 30 40 50 (°) 60 70 80 Strong (weak) mixing between local and CT configurations in the GS (ES) geometry 90


