RETIREMENT
RESEARCH
July 2014, Number 14-11
HOW MUCH SHOULD PEOPLE SAVE?
By Alicia H. Munnell, Anthony Webb, and Wenliang Hou*
Introduction
Nuts and Bolts of the NRRI
The National Retirement Risk Index (NRRI) shows
that half of today’s working families are “at risk” of
not being able to maintain their standard of living
once they retire. This result is not surprising given
that half of private sector workers do not have an employer–sponsored retirement plan and that many who
do have a plan save relatively little. The question is
how much households would have to save in order to
maintain their pre-retirement living standards. This
analysis employs the NRRI infrastructure in a slightly
different way to answer this question in three steps.
What is the average amount of saving that will come
from retirement savings plans? What is the average
required saving rate to produce adequate retirement
income? Given current saving patterns, how much
more would households have to save?
The discussion proceeds as follows. The first
section recaps the nuts and bolts of the NRRI and
describes the target calculations that serve as the basis
for this analysis. The second section describes the
methodology for answering each of the three questions. The third section discusses the benefits of
starting to save early and retiring late. The final section concludes that a saving rate of about 15 percent
of income would be sufficient to achieve retirement
income targets. Among those households currently
falling short, attaining the necessary saving rate is a
much more feasible goal for younger households than
for older households.
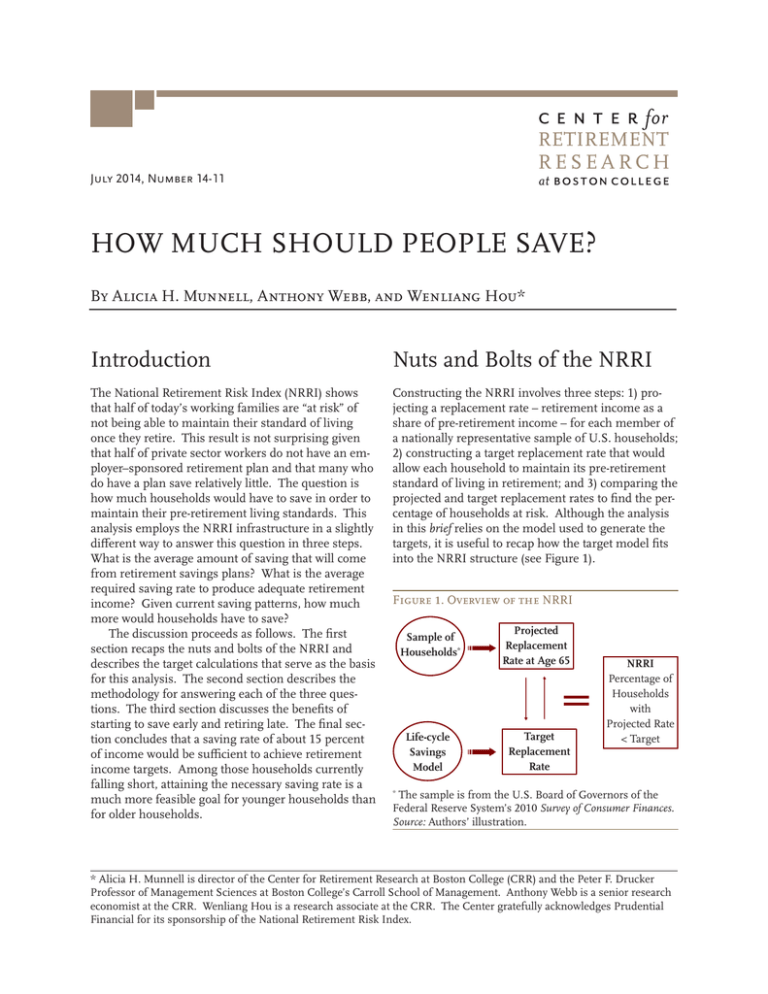
Constructing the NRRI involves three steps: 1) projecting a replacement rate – retirement income as a
share of pre-retirement income – for each member of
a nationally representative sample of U.S. households;
2) constructing a target replacement rate that would
allow each household to maintain its pre-retirement
standard of living in retirement; and 3) comparing the
projected and target replacement rates to find the percentage of households at risk. Although the analysis
in this brief relies on the model used to generate the
targets, it is useful to recap how the target model fits
into the NRRI structure (see Figure 1).
Figure 1. Overview of the NRRI
Sample of
Households*
Projected
Replacement
Rate at Age 65
=
Life-cycle
Savings
Model
Target
Replacement
Rate
NRRI
Percentage of
Households
with
Projected Rate
< Target
The sample is from the U.S. Board of Governors of the
Federal Reserve System’s 2010 Survey of Consumer Finances.
Source: Authors’ illustration.
*
* Alicia H. Munnell is director of the Center for Retirement Research at Boston College (CRR) and the Peter F. Drucker
Professor of Management Sciences at Boston College’s Carroll School of Management. Anthony Webb is a senior research
economist at the CRR. Wenliang Hou is a research associate at the CRR. The Center gratefully acknowledges Prudential
Financial for its sponsorship of the National Retirement Risk Index.
2
Center for Retirement Research
Projecting Household Replacement Rates
The exercise starts with projecting how much retirement income each of today’s working households will
have at age 65. Retirement income is defined broadly
to include all of the usual suspects plus housing.1 Retirement income from financial assets and housing is
derived by projecting assets that households will hold
at retirement, based on the stable relationship between wealth-to-income ratios and age evident in the
Federal Reserve’s Survey of Consumer Finances (SCF)
during the 1983-2010 period (see Figure 2).2 In the
case of housing, the projections are used to calculate
two distinct sources of income: the rental value that
homeowners receive from living in their home rent
free – “imputed rent” – and the amount of equity they
could borrow from their housing wealth through a
reverse mortgage.3 Sources of retirement income that
are not derived from SCF reported wealth – namely,
income from defined benefit pensions and Social
Security – are estimated directly. Once estimated, the
components are added together to get total projected
retirement income at age 65.
Figure 2. Ratio of Wealth to Income from the
Surveys of Consumer Finances, 1983-2010
6
4
2
0
1983
1986
1989
1992
1995
1998
2001
2004
2007
2010
20-22 26-28 32-34 38-40 44-46 50-52 56-58 62-64
Age
Source: Authors’ calculations based on U.S. Board of Governors of the Federal Reserve System, Survey of Consumer
Finances (SCF), 1983-2010.
To calculate projected replacement rates, we
also need income prior to retirement. Earnings are
calculated by creating a wage-indexed earnings history and averaging each individual’s annual indexed
wages over his lifetime. Other items that comprise
pre-retirement income include the return on 401(k)
plans, other financial assets, and imputed rent from
housing.4 Average lifetime income then serves as the
denominator for each household’s replacement rate.
Estimating Target Replacement Rates
To determine the share of households that will be
at risk requires comparing projected replacement
rates with target replacement rates. The NRRI target
assumes that the household’s goal is to accumulate
sufficient wealth to generate a level of post-retirement
consumption that equals consumption immediately
before retirement. The household achieves this goal
by choosing an age-varying saving rate. The target replacement rate is the ratio of post-retirement income
to pre-retirement income associated with the optimal
saving strategy. Pre-retirement income equals labor
market earnings, imputed rent, and investment
returns, minus mortgage and loan interest paid, all
averaged over ages 20-65.5 Post-retirement income
equals income from Social Security, employer pensions, and an inflation-indexed annuity, plus imputed
rent. The household is assumed to purchase an
inflation-indexed annuity with its financial assets plus
the proceeds of a reverse mortgage. The calculations
include federal, state (Massachusetts), and Social Security taxes, including the Earned Income Tax Credit
and the favorable tax treatment accorded to income
from Social Security.6
Targets are calculated for 48 types of households
– those in the bottom, middle, and top tercile of the
income distribution who are single men, single women, or one- or two-earner couples, with or without
defined benefit pensions, and who are homeowners
or renters. Weighted averages are calculated to yield
targets for three income terciles for single men, single
women, and one- and two-earner couples. Overall the
replacement rates that emerge from the target model
are consistent with those from other approaches (see
Table 1).7
Table 1. NRRI Target Replacement Rates
Income group
Target replacement rate
All
73 %
Low income
80
Middle income
71
High income
67
Source: Authors’ calculations.
3
Issue in Brief
Calculating the Index
The final step in creating the NRRI is to compare
each household’s projected replacement rate with
its target. Households whose projected replacement
rates fall more than 10 percent below their targets are
deemed to be at risk of having insufficient income to
maintain their pre-retirement standard of living. The
NRRI is simply the percentage of all households that
fall more than 10 percent short of their target. Figure
3 shows the Index from 1983 to 2010. The NRRI will
be updated in early 2015 with the release of data from
the Federal Reserve’s 2013 SCF.
Figure 3. The National Retirement Risk Index,
1983-2010
60%
53%
37% 38%
40%
40%
38%
45% 44%
31% 31% 30%
20%
0%
Source: Munnell, Webb, and Golub-Sass (2012).
Using the Target Model to
Calculate Needed Saving Rates
The target model can be queried to answer the questions about required saving through employer plans.
Employer plans include both traditional defined
benefit plans and defined contribution – primarily
401(k) – plans.8 Private sector defined benefit plans
generally do not require any direct employee contributions; however, these benefits – just like employer
contributions to a 401(k) – are not “free” in that they
are part of a worker’s total compensation and a form
of workers’ retirement saving. In the following analysis, saving in defined benefit plans is calculated based
on reported defined benefit income and is combined
with saving in defined contribution plans.9 Since de-
fined contribution plans are rapidly replacing defined
benefit plans in the private sector, the results below
can be thought of as 401(k) saving rates.
The simplest question is what portion of retirement income needs to come from retirement savings plans. This percentage will vary by household
income, since Social Security’s progressive benefits
replace a higher portion of pre-retirement income for
lower-income households than for those with higher
incomes. Table 2 shows the percentage of income
that households must generate through savings in
employer retirement plans to produce their target
replacement rates.
While both pre-retirement and retirement income
include imputed rent, this number is not included in
the percentage calculation. For example, the middle
household will require 71 percent of pre-retirement
income to maintain pre-retirement living standards.
This amount breaks down as follows: 41 percent of
pre-retirement income from Social Security, 4 percent from the reverse mortgage, and 6 percent from
imputed rent, which means that the rest – 21 percent
– needs to come from retirement savings plans.10 The
32 percent reported in the table is simply the ratio of
21/(41+21+4), so it excludes imputed rent. The takeaway here is that a quarter of retirement income must
come from retirement savings plans for low-income
households, one third for the middle income, and half
for the high income.
Table 2. Percentage of Retirement Income
Required from Retirement Savings Plans
Income group
Percentage of
retirement income
All
35 %
Low income
25
Middle income
32
High income
47
Note: Retirement savings plans include defined benefit
plans, defined contribution plans, and IRAs.
Source: Authors’ calculations.
The second question is how much households
must save over their worklives to generate the
required amount of income. This number falls out
of the target calculation, since the target saving rate
is the rate that allows households to maintain their
pre-retirement consumption once they stop working.
4
Center for Retirement Research
Again, nothing is simple. Saving can be measured
in any number of ways, given the pattern of income
and consumption in the target model. The concept
reported here measures net saving – positive saving
less amounts required to pay off debts – divided by
income from the age at which debt is repaid to age 65
(see Figure 4).
Figure 4. Calculation of Saving Rates from the
Target Model
Income
Consumption
Income period
20
65
tude of the shortfall. Second, we calculate the percentage of income that the household needs to save
each year so that the accumulated additional savings,
when annuitized at age 65, will bring the household’s
total income up to the target. Third, we divide the
shortfall in replacement rate by the additional replacement income from a 1-percent increase in saving to
calculate the required additional saving.
The median required increases in the saving rate
are shown in Table 4. The most sensible way to look
at these numbers is by age group. A feasible increase
in saving rates at younger ages can have a large effect
on wealth at age 65. In contrast, people in their 50s
have so little time before retirement that middle-income households would have to increase their saving
by an unrealistic 29 percentage points of income to
reach their target. A better strategy for these households would be to work longer and cut current and
future consumption in order to reduce the required
saving rate to a more feasible level.
Table 4. Required Increase in Saving Rates for
Households Falling Short (Percentage Points)
Age
Source: Authors’ illustration.
Age
The required saving rate produced by these
calculations is 15 percent for the middle income
household (see Table 3). These saving rates represent
total saving in retirement plans, which includes both
employee and employer contributions.11
Table 3. Required Saving Rates from Retirement
Savings Plans
Income group
Required saving rate
All
14 %
Low income
11
Middle income
15
High income
16
Source: Authors’ calculations.
The final question is how much more households
would need to save to hit their target replacement
rates. This analysis proceeds in three steps. First, for
each household in the NRRI, we compare its projected replacement rate to its target in order to identify
the half of households falling short and the magni-
Household income (tercile)
Low
Middle
High
30-39
8
7
7
40-49
16
13
13
50-59
35
29
30
Source: Authors’ calculations.
Importance of Starting Early
and Retiring Late
The NRRI target calculations effectively have households beginning retirement saving in their mid-30s
and retiring at 65, which produces high required
saving rates. The required saving rates, however, are
very sensitive to assumptions about starting and ending dates. Consider a simple Excel spreadsheet example of individuals earning the average wage and planning to retire at 65 in 2040. Under current law, Social
Security will replace 36 percent of their final inflationadjusted earnings, so they have to save enough on
their own to replace 34 percent (70 percent minus 36
percent). Assuming individuals purchase an annuity
at retirement that produces steady inflation-adjusted
consumption, average workers need to accumulate
5
Issue in Brief
investments of $538,000. If they start saving at 35
and earn a real return of 4 percent, they will need to
save 15 percent of earnings each and every year to be
able to retire at 65 with financial security (see Table
5). However, if they delay retirement to 70, that figure
drops from 15 percent to 6 percent. Starting to save
earlier would bring the rate even lower.
Table 5. Saving Rate Required for a Medium
Earner to Attain a 70-Percent Replacement Rate
Retire at:
Start saving at:
25
35
45
62
15 %
24 %
44 %
65
10
15
27
67
7
12
20
70
4
6
10
Note: The calculations assume a real rate of return of 4 percent and the purchase of an inflation-indexed annuity with
the same rate as in the National Retirement Risk Index.
Source: Authors’ calculations.
Conclusion
Currently, about half of working-age households are
not saving enough to maintain their pre-retirement
standard of living in retirement. To supplement
Social Security, depending on their income level,
households should plan to get between one-quarter
to one-half of their retirement income from retirement savings plans, such as 401(k)s. To produce this
income, the typical household needs to save about 15
percent of earnings, well above today’s actual saving
rates. Low-income households need to save less and
high-income households more. For those households
currently identified as having a savings shortfall in
the National Retirement Risk Index, the necessary
increase in saving depends crucially on their age;
younger households need to boost their saving by a
feasible amount while older households would need
to work longer to moderate the need for additional
saving.
6
Center for Retirement Research
Endnotes
1 The Index does not include income from work,
since labor force participation declines rapidly as
people age.
2 Both mortgage debt and non-mortgage debt are
subtracted from the appropriate components of projected wealth.
3 For 401(k) assets, other financial wealth, and housing wealth, the assumption is that households convert
the wealth into a stream of income by purchasing
an inflation-indexed annuity – that is, an annuity
that will provide them with a payment linked to the
Consumer Price Index for the rest of their lives. For
couples, the annuity provides the surviving spouse
two-thirds of the base amount. While inflationindexed annuities are not widely used by consumers,
they provide a convenient metric for calculating the
lifetime income that can be obtained from a lump
sum. And while inflation-indexed annuities provide
a smaller initial benefit than nominal annuities, over
time they protect a household’s purchasing power
against the erosive effects of inflation.
4 As with the components of retirement income,
both mortgage debt and non-mortgage debt are
subtracted from the appropriate components of preretirement income.
5 Low, middle, and high earners experience wage
increases derived from Clingman and Nichols (2004).
The calculations assume that young households are
able to borrow if their desired consumption exceeds
their net income. They also assume that, during their
working lives, households optimally choose a level of
consumption that increases at the rate of 1 percent a
year.
6 The calculations assume that both housing and
financial assets yield a historical real return. The
secondary earner joins the household at age 25
with zero assets. Married couples, single men, and
single women face annuity rates corresponding to
the income payable on inflation-indexed annuities
for members of the 1956 birth cohort at 2004 interest rates and expense loads. At age 30, homeowners
purchase a house valued at twice their age-50 earnings with the aid of a 30-year mortgage at a real interest rate of 2.23 percent. At retirement, homeowners
can borrow a portion of the value of the house on a
reverse mortgage.
7 See Palmer (2008). Lower-income households
require higher replacement rates, because they pay
little in taxes and need to save little for retirement and
therefore do not experience much relief from these
payments upon retirement.
8 IRA assets are also included in employer plans
because the large majority of these assets are simply
rolled over from 401(k)s. In addition, for the sake of
simplicity, savings outside of employer plans – which
are very small for most households – are also included.
9 A simpler alternative calculation would be to
exclude households with defined benefit plans from
the analysis, but this approach unnecessarily discards
too much information that is relevant to determining
average saving rates.
10 The imputed rent assumption is broadly consistent with estimates by Poterba and Sinai (2008) of
homeowner user costs – which, in addition to imputed rent, include property taxes and maintenance.
11 One question is whether people can achieve these
saving rates under the current system, given that
401(k) contributions are limited to specified dollar
amounts (currently $17,500 for those under age 50
and $22,000 for those age 50 and over). The answer
is yes. Currently only about 5 percent of workers
(both those under and over age 50) have incomes so
high that they would be constrained by the 401(k)
contribution limits. And, even for these individuals,
widespread acceptance of the need for more retirement saving could persuade employers to raise their
matching contributions. If so, plenty of room exists
for additional employer contributions because the
combined employer-employee contribution limit
is $52,000. Alternatively, individuals could always
choose to save outside of tax-deferred retirement accounts.
Issue in Brief
References
Clingman, Michael and Orlo Nichols. 2004. “Scaled
Factors for Hypothetical Earnings Examples under
the 2004 Trustees Report Assumptions.” Actuarial
Note, 2004.3. Washington DC: Office of the Chief
Actuary, Social Security Administration.
Munnell, Alicia H., Anthony Webb, and Francesca
Golub-Sass. 2012. “The National Retirement Risk
Index: An Update.” Issue in Brief 12-20. Chestnut
Hill, MA: Center for Retirement Research at Boston College.
Palmer, Bruce A. 2008. “2008 GSU/Aon RETIRE
Project Report.” Research Report Series 08-1.
Atlanta, GA: J Mack Robinson College of Business,
Georgia State University.
Poterba, James, and Todd Sinai. 2008. “Tax Expenditures for Owner-Occupied Housing: Deductions
for Property Taxes and Mortgage Interest and the
Exclusion of Imputed Rental Income.” American
Economic Review 98(2): 84-89.
U.S. Board of Governors of the Federal Reserve
System. Survey of Consumer Finances, 1983-2010.
Washington, DC.
7
RETIREMENT
RESEARCH
About the Center
The mission of the Center for Retirement Research
at Boston College is to produce first-class research
and educational tools and forge a strong link between
the academic community and decision-makers in the
public and private sectors around an issue of critical importance to the nation’s future. To achieve
this mission, the Center sponsors a wide variety of
research projects, transmits new findings to a broad
audience, trains new scholars, and broadens access to
valuable data sources. Since its inception in 1998, the
Center has established a reputation as an authoritative source of information on all major aspects of the
retirement income debate.
© 2014, by Trustees of Boston College, Center for Retirement Research. All rights reserved. Short sections of text,
not to exceed two paragraphs, may be quoted without explicit permission provided that the authors are identified and
full credit, including copyright notice, is given to Trustees of
Boston College, Center for Retirement Research.
Affiliated Institutions
The Brookings Institution
Massachusetts Institute of Technology
Syracuse University
Urban Institute
Contact Information
Center for Retirement Research
Boston College
Hovey House
140 Commonwealth Avenue
Chestnut Hill, MA 02467-3808
Phone: (617) 552-1762
Fax: (617) 552-0191
E-mail: crr@bc.edu
Website: http://crr.bc.edu
The research reported herein was supported by Prudential
Financial. The findings and conclusions expressed are solely
those of the authors and do not represent the opinions or
policy of Prudential Financial or the Center for Retirement
Research at Boston College.


