Document 12786921
advertisement
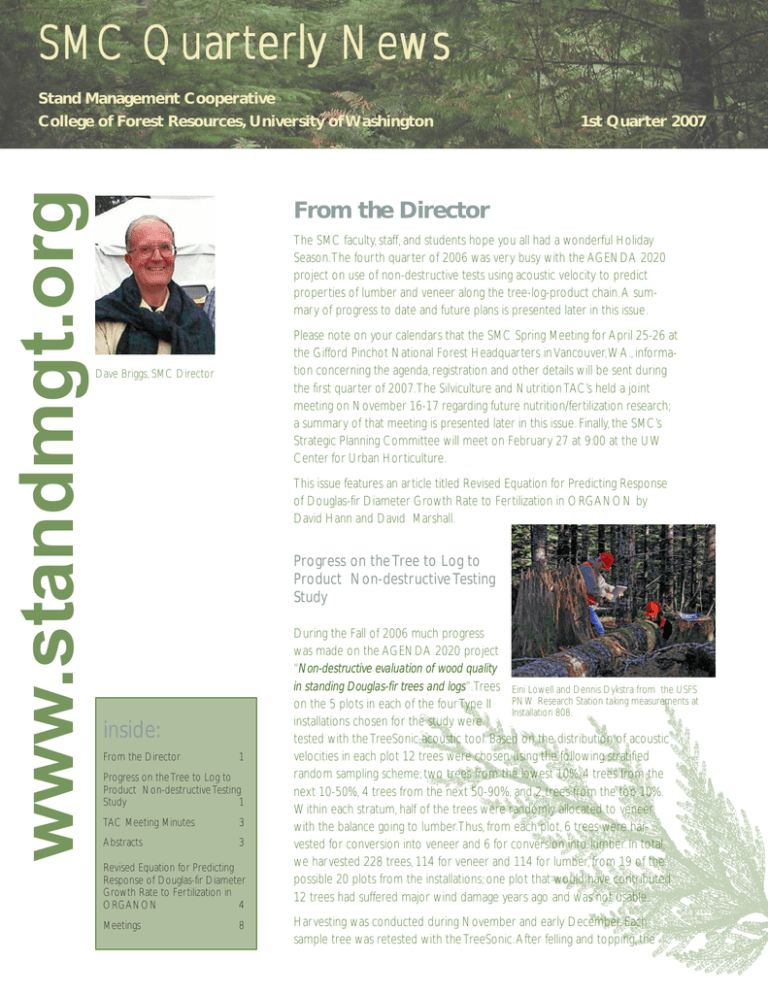
SMC Quar ter ly News www.standmgt.org Stand Management Cooperative College of Forest Resources, University of Washington 1st Quarter 2007 From the Director The SMC faculty, staff, and students hope you all had a wonderful Holiday Season.The fourth quarter of 2006 was very busy with the AGENDA 2020 project on use of non-destructive tests using acoustic velocity to predict properties of lumber and veneer along the tree-log-product chain. A sum­ mary of progress to date and future plans is presented later in this issue. Please note on your calendars that the SMC Spring Meeting for April 25-26 at the Gifford Pinchot National Forest Headquarters in Vancouver,WA., informa­ tion concerning the agenda, registration and other details will be sent during the first quarter of 2007.The Silviculture and Nutrition TAC’s held a joint meeting on November 16-17 regarding future nutrition/fertilization research; a summary of that meeting is presented later in this issue. Finally, the SMC’s Strategic Planning Committee will meet on February 27 at 9:00 at the UW Center for Urban Horticulture. Dave Briggs, SMC Director This issue features an article titled Revised Equation for Predicting Response of Douglas-fir Diameter Growth Rate to Fertilization in ORGANON by David Hann and David Marshall. Progress on the Tree to Log to Product Non-destructive Testing Study inside: From the Director 1 Progress on the Tree to Log to Product Non-destructive Testing Study 1 TAC Meeting Minutes 3 Abstracts 3 Revised Equation for Predicting Response of Douglas-fir Diameter Growth Rate to Fertilization in ORGANON 4 Meetings 8 During the Fall of 2006 much progress was made on the AGENDA 2020 project “Non-destructive evaluation of wood quality in standing Douglas-fir trees and logs”.Trees Eini Lowell and Dennis Dykstra from the USFS PNW Research Station taking measurements at on the 5 plots in each of the four Type II Installation 808. installations chosen for the study were tested with the TreeSonic acoustic tool. Based on the distribution of acoustic velocities in each plot 12 trees were chosen using the following stratified random sampling scheme; two trees from the lowest 10%, 4 trees from the next 10-50%, 4 trees from the next 50-90%, and 2 trees from the top 10%. Within each stratum, half of the trees were randomly allocated to veneer with the balance going to lumber.Thus, from each plot, 6 trees were har­ vested for conversion into veneer and 6 for conversion into lumber. In total, we harvested 228 trees, 114 for veneer and 114 for lumber, from 19 of the possible 20 plots from the installations; one plot that would have contributed 12 trees had suffered major wind damage years ago and was not usable. Harvesting was conducted during November and early December. Each sample tree was retested with the TreeSonic. After felling and topping, the merchantable bole was tested using the HM-200 acoustic log tool and measured and marked for bucking. Log marking attempted to maximize 35’s for veneer (two 17’s, four peeler blocks) and 33’s for lumber (two 16’s); some SMC Field Crew Bob Gonyea and Bert shorter lengths were produced at tops, breaks, or major Hasselberg working with the “cookies”at defects. During bucking, a 1-2 inch thick cross-section disk Installation 808. or “cookie” was removed at the stump and top of each woods log.The cookies were measured on site for diameters inside and outside bark, at age 10 and 20, and at the heartwood boundary; for green weight, and for green volume. Oven dry weights are being obtained at the UW lab. All logs were tagged at both ends with a code to ensure identification to installation, plot, tree and location within the tree.This involved 2-3 days work per installation plus travel time by 7-8 people from UW and the USFS PNW Research Station plus the logger and landowner’s supervisory personnel.Veneer logs were hauled to the CFR graduate Emily Gonzalez and Megan Weyerhaeuser veneer mill in Foster, OR and sawlogs where hauled to the South O’Shea, SMC staff taking log measurements Union Sawmill in Elma,WA. Unfortunately, wet conditions prevented delivery of veneer logs from one installation in time for the scheduled peeling; instead they have been shipped to the sawmill site where detailed log data, described in the next paragraph, will be collected from them. Veneer peeling was scheduled for December 15, so December 8-10 were devoted to obtaining detailed measurements on rolled out logs at the log yard.This work involved 6 from the USFS PNW Research Station, a log scaling team of 2, 6 from the UW, and one from OSU. All log bucking was done by a Weyerhaeuser employee.Woods logs were scaled in cubic and Scribner, measured for acoustic velocity with the HM-200, marked for bucking into 17’s (2 peeler blocks), and each marked 17 was measured for the largest diameter knot in each log quadrant and ramicorns were tallied separately; measuring all knots was not possible within the Dennis Dykstra checking tags on limited time frame. After woods logs were bucked into 17’s, cookies were taken at bucked logs the buck point to ensure that we have a cookie from each end of every short log. These short logs were also re-scaled and measured with the HM-200 and tagged to maintain identity to installation, plot, tree, and location within the tree. Finally, the short logs were debarked, converted into peeler bocks, measured for diameter, and tagged again to maintain identity.The tagged blocks were placed in heat conditioning chambers the night before peeling. 2 We returned on December 14 for a mill safety orientation, and mill tour to review responsibili­ ties of people at various tracking points along the process. Overnight, the mill lost power during the wind storm so the blocks did not complete the conditioning process. Peeling was Bert Hasselberg spraying veneer Weyerhaeuser veneer mill in Foster, OR. re-scheduled for December 18 and completed peeling at 4:30 on December 19.Veneer from each block was sprayed with a unique color combination and all full and half sheets were individually numbered to reflect relative position in the block.The full and half sheets were dried by Weyerhaeuser the next day and have been shipped to the US Forest Products Laboratory in Madison, WI for testing.This work involved 6 from the USFS PNWRS, 5 from the UW, 2 from OSU, and Dan Wessel,Weyerhaeuser shift supervisor and the shift crew; many thanks to all for their help. In total, the 114 veneer trees from the 4 installations produced 286 woods logs of which 50 logs from the 30 trees at one installation did not arrive in time due to wet conditions that prevented extraction.Thus, we had 236 logs from 84 veneer trees which yielded 693 blocks from which 31 units of full sheets and 4 units of half-sheets were recovered for testing. A similar series of activities for logs from the 114 sawmill trees will take place at the South Union Sawmill before the end of March.The veneer logs that were not extracted in time for peeling have been delivered to the sawmill site where we will gather the log data described above. Staff from the UW and the USFS PNW Research Station at the Weyerhaeuser veneer mill in Foster, OR. Nutr ition/ Silviculture TAC Meeting Nutrition/ The SMC Nutrition and Silviculture TACs met jointly on 16 Sep 2006, at the Gifford Pinchot NF headquarters in Vancouver, WA following the NWTIC meeting. GGTIV (Genetic Gains / Type IV) tr ials trials First on the agenda was to clarify how re-treatment of the complete vegetation control plots in the joint NWTIC Genetic Gain / SMC Type IV (so-called GGTIV) trials would be conducted. Keith Jayawickrama reminded everyone that NWTIC will be paying for retreatment of all plantations in spring 2007. Keith will meet and work closely with Greg Jones Forestry to make sure any and all spraying is done in an appropriate and timely fashion. The SMC will be measuring the 2005 plantations for the first time this winter, i.e., following two growing seasons. Design of SMC Fer tilization Tr ials Fertilization In part due to the fact that fertilization as a controlled experimental factor is noticeably absent from the GGTIV study design, and due to other motivating forces as well, much discussion in advance of this meeting occurred regarding the continuation of SMC fertiliza­ tion experiments. There was much interest in refining estimates of gain in yield when fertilizer is applied after commercial thinning of Douglas-fir. Interest prior to this meeting was also expressed in studies to estimate the effects of fertilization on growth, yield and quality when fertilizer is applied to young stands. The so-called Response Surface Experi­ mental Design had been forwarded as a methodology to address these issues, as well as using smaller plot sizes to gain replication at lower expense and spatial commitment at both SMC bi-annual Policy Committee meetings in 2006 and met with some approval. Nutrition and Silviculture Project Leaders were directed to pursue further development of a study along these lines. The Response Surface Design methodology was reviewed and discussion began moving toward an example of how a study could be designed using that protocol. After much discussion, emphasis shifted away from a highly designed experiment to address fertilization in young and commercially thinned stands, instead shifting toward a study that focused on the more basic question of whether or not a particular site, given its geology, hydrology, topography, edaphic, and climatic conditions, was capable of responding to elemental fertilizer applications, namely phosphorous and nitrogen. A rudimentary design using single tree trials was hammered out. Nutrition and Silviculture project leaders were directed to flesh out a more detailed proposal for study and approval by the TACs to be taken eventually to the Policy Committee for ultimate approval. Abstr acts and Abstracts Pub lications Publications John M. Hagan and Whitman,Andrew A. Biodiversity Indicators for Sustainable Forestry: Simplifying Complexity. Journal of Forestry,Volume 104, Number 4, June 2006, pp. 203-210(8) ABSTRACT: Maintaining biodiversity is a primary goal of sustainable forestry. However, maintaining “life in all its forms” can be daunting to forest managers. “Biodiversity,” as commonly defined, is simply too complex to measure or monitor.The only practical solution is to use indicators. In theory, good indicators are simple to measure and correlate with many other elements of biodiversity so they do not also have to be measured.All sustain­ able forestry programs use indicators; however, there is much confusion and frustration among forest managers and stakeholders about their usefulness. The primary limitation to selecting effective indicators has to do with process, not science. Here, we propose a framework for selecting biodiversity indictors that will better inform decisionmakers and stakeholders. 3 Revised Equation for Predicting Response of Douglas-fir Diameter Growth Rate to Fer tilization in ORGANON David Hann, OSU and David Marshall,Weyerhaeuser Company Introduction In a comparison of the responses predicted by six regional growth models to various treatments, Johnson (2005) reported that the SMC version of ORGANON (SMC­ ORGANON) predicted the most conservative (smallest) response to fertilization of all the models. This finding led us to conduct an exhaustive review of the modeling techniques and assumptions used by Hann et al. (2003) to develop the fertilization response equations in SMC-ORGANON. The intent of this article is to report the findings of this review and subsequent reanalysis. Data Analysis The fertilization data used in this reanalysis was the same used to develop the final param­ eter estimates for Douglas-fir found in Table 41 of Hann et al. (2003). That data set had excluded all Canadian data because of problems described in detail on page 65 of Hann et al. (2003). The basic model form used by Hann et al. (2003) to predict the diameter growth rate (∆D) of a tree fertilized with nitrogen is: ∆DF = P∆DC x FR∆D + εF [1] Where, ∆DF = actual five-year ∆D of a fertilized tree P∆DC = predicted five-year ∆D of the tree if it had been untreated FR∆D = predicted direct response of five-year ∆D to fertilization εF = random error Hann et al. (2003) found that the following equation best characterized the response from a single fertilization: SFR∆D = 1.0 + b0 (PN1 /100)b1 eb2YF1 +b3 [(SI −4.5) /100) 2 [2] Where, SFR∆D = predicted direct response of five-year D to fertilization = ∆DF/ P∆DC PN1 = number of pounds of nitrogen applied in the first fertilization 4 YF1 = number of years since the first fertilization New Edition of ORGANON Hann et al. (2003) then used equation [2] and its parameter estimates to predict the response of five-year ΔD to multiple fertilizations (equation [11] on page 35 of Hann et al. 2003). One limitation of the fertilization data set was the lack of crown ratio (CR) measurements on the trees.We originally circumvented this problem by developing a “regional” equation for untreated ΔD that was a function of either measured CR if available or predicted CR if not. We then predicted CR for all of the trees in the fertilized data set and applied the regional equation to estimate ΔD of each of the fertilized trees as they had not been fertilized.To further reduce measurement error in the dependent variable, we first calibrated the regional equation to the diameter growth measurements from the control plot(s) in each installation before applying it to the fertilized data for calculation of the dependent variable, SFRΔD. Further details on these procedures can be found in Hann et al. (2003). David Hann recently announced that a new edition (8.2) of the console variant of ORGANON is available on the ORGANON website. It includes the new fertilization response modifier for the Douglas-fir diameter growth equations and new diameter growth rate, mortality growth rate, height/diameter and height to crown base equations for Oregon white oak. A new set of ORGANON DLL’s has also been loaded onto the ORGA­ NON website with new manuals. All of these procedures for estimating SFRΔD were reexamined in this reanalysis of fertiliza­ tion response. Ultimately we concluded that the use of predicted CR in the untreated ΔD equation unnecessarily introduced measurement error to the approach which then distorted fertilization response.We therefore developed a new ΔD equation for untreated data based upon the equation form of Hann et al. (2006) but excluding CR and this equation was used to calculate the dependent variable.The resulting data set was then fit to equation [2] using nonlinear regression.The revised parameter estimates and their asymptotic standard errors for equation [2] are found in Table 1. Results and Discussion The new fertilization response equation predicts that an application of 200 pounds of nitrogen per acre would result in an increase in ΔD for the first five year growth period after fertilization of 22.5 percent for a tree on land with a site index of 100 feet, an increase of 15.7 percent if the site index was120 feet, and an increase of 10.3 percent if the site index was140 (Table 2).The equivalent values from the old equation were 17.9 percent, 11.2 percent, and 6.4 percent, respectively.The application of 400 pounds of nitrogen per acre results in the new equation predicting an increase in ΔD for the first five year growth period after fertilization of 37.6 percent for a tree on land with a site index of 100 feet, an increase of 26.3 percent if the site index was120 feet, and an increase of 17.1 percent if the site index was140 (Table 2).The equivalent values from the old equation were 30.7 percent, 19.2 percent, and 11.0 percent, respectively. Regardless of the amount of fertilizer applied or the site index of the stand, these increases in predicted ΔD trended towards zero with an increase in the number of growth periods since the application of fertilizer. We applied the new and old fertilization response equations to the tree lists used in the Johnson (2005) comparison in order to illustrate how predictions from the fertilization response equations behaved at the stand level with the application of 200 pounds of nitrogen per acre. In the following comparisons, the results from the new equation will be given first followed by the results from the old equation in parentheses. The increase in gross basal area growth per acre (ΔBA) in the first growth period after fertilization was +23.9 percent (+18.7 percent) for the stand with a site index of 100 feet, +16.1 percent (+11.1 percent) for the stand with a site index of 120 feet, and +10.7 percent (+6.5 percent) for the stand with a site index of 140 feet (Table 3). The increases in predicted gross ΔBA quickly trended towards zero and then negative values (i.e., decreases in ΔBA when compared to the untreated stand) with an increase in the number of growth periods since fertilization.The 5 trend towards negative values is, in part, caused by the increase in competition due to the increase in stand BA from the early direct response to fertilization, and it is an illustration of the impact upon stand development of indirect responses due to fertilization. The increase in gross total stem cubic foot volume growth per acre (∆TSCFV) in the first growth period after fertilization was +18.8 percent (+15.7 percent) for the stand with a site index of 100 feet, +11.2 percent (+8.9 percent) for the stand with a site index of 120 feet, and +6.9 percent (+4.7 percent) for the stand with a site index of 140 feet (Table 3). As with BA, these increases in predicted gross ∆TSCFV quickly trended towards zero and then negative values with an increase in the number of growth periods since fertilization. It can be shown that ∆TSCFV is a function of both ∆BA and the change in top height of the stand (∆H40) through the relationship: ∆TSCFV ∼ (∆BA x H40 + ∆H40 x BA + ∆BA x ∆H40) Therefore, the relative impact of fertilization upon ∆TSCFV will not necessarily equal the relative impact of fertilization upon ∆BA. In the comparison performed in this study, the percent increases in ∆TSCFV were lower than the percent increases in ∆BA. The reanalysis of the fertilization data has resulted in a new fertilization modifier equation for Douglas-fir ∆D that produces substantially larger predictions than the old equation. This new equation has been incorporated into the latest edition of ORGANON which also includes the new SMC equations of Hann et al. (2006).The ORGANON model and/or DLL, including user manuals can be downloaded from: http://www.cof.orst.edu/cof/fr/ research/organon/. Literature Cited Hann, D.W., D.D. Marshall, and M.L. Hanus. 2003. Equations for predicting height-to-crown-base, 5­ year diameter-growth rate, 5-year height-growth rate, 5-year mortality rate, and maximum sizedensity trajectory for Douglas-fir and western hemlock in the coastal region of the Pacific Northwest. Oregon State University, College of Forestry, Forest Research Laboratory, Corvallis, Oregon. Research Contribution 40. 83p. http://fcg.cof.orst.edu/structur/pubs_view.php#rc. Hann, D.W., D.D. Marshall, and M.L. Hanus. 2006. Reanalysis of the SMC-ORGANON equations for diameter-growth rate, height-growth rate, and mortality rate of Douglas-fir. Oregon State University, College of Forestry, Forest Research Laboratory, Corvallis, Oregon. Research Contribution 49. 24p. Johnson, G. 2005. Growth model runoff II. Growth model users group web site: www.growthmodel.org/papers/gmroII.pdf. Tab le 1. Revised parameter estimates and asymptotic standard errors for predicting the able response of five-year diameter growth rate to a single fertilization in Douglas-fir, equations [1] and [2]. Parameters b0 b1 b2 b3 6 Estimate 1.368661121 0.741476964 -0.214741684 -0.851736558 Standard Error 0.171212458 0.085170925 0.031545740 0.075782280 Tab le 2. Comparison of the predictions of five-year percent increase in diameter growth able rate from the old and new fertilization response equations due to a single fertilization with either 200 or 400 pounds of nitrogen per acre by site index and number of growth periods since fertilization. Site Index 100 100 100 100 120 120 120 120 140 140 140 140 Number of Fiveyear Growth Periods Since Fertilization 0 1 2 3 0 1 2 3 0 1 2 3 Percent Increase in Diameter Growth Rate 200 Pounds Nitrogen 400 Pounds Nitrogen Old Eq. New Eq. Old Eq. New Eq. 17.9 5.6 1.7 0.5 11.2 3.5 1.1 0.3 6.4 2.0 0.6 0.2 22.5 7.7 2.6 0.9 15.7 5.4 1.8 0.6 10.3 3.5 1.2 0,4 30.7 9.5 3.0 0.9 19.2 6.0 1.9 0.6 11.0 3.4 1.1 0.3 37.6 12.9 4.4 1.5 26.3 9.0 3.1 1.0 17.1 5.9 2.0 0.7 Tab le 3. Comparison of the predictions of five-year percent increase in gross basal area able growth rate per acre and gross total stem cubic foot volume growth rate per acre from the old and new fertilization response equations due to a single fertilization of 200 pounds of nitrogen per acre by site index and number of growth periods since fertilization. Site Index 100 100 100 100 120 120 120 120 140 140 140 140 Number of Five-year Growth Periods Since Fertilization 0 1 2 3 0 1 2 3 0 1 2 3 Percent Change Gross Total Stem Cubic Gross Foot Volume Growth Rate Basal Area Growth Rate per Acre per Acre Old Eq. New Eq. Old Eq. New Eq. +18.7 +23.9 +15.7 +18.8 +3.2 +4.7 +2.7 +3.9 -1.2 -1.2 +0.3 +0.6 -2.3 -2.3 -0.5 -0.6 +11.1 +16.1 +8.9 +11.2 +1.9 +3.4 +1.7 +2.8 -0.9 -0.9 +0.2 +0.4 -1.4 -1.0 +0.0 +0.0 +6.5 +10.7 +4.7 +6.9 +1.0 +2.0 +1.0 +1.7 -0.4 -0.4 +0.1 +0.4 -0.9 -1,4 -0.1 -0.2 7 Upcoming Meetings and Ev ents Events ents Januar ies: Forest Industr y Globalization uaryy 25, 2007, 4:00 PM, CH2M Hill Alumni Center, OSU, Star Starkker Lecture Ser Series: and Consolidation: A Famil y-held Compan y’ er spectiv e . For more information on the series visit: http:// Family-held Company’ y’ss PPer erspectiv spective www.cof.orst.edu/starkerlectures/ Febr uar ter s, Black Lake Februar uaryy 10, 2007, 8:00 AM, Fall Forestr Forestryy Educational Seminar. O lympic National Forest Headquar Headquarter ters, Blvd. O lympia, WA. For more information contact Norma Green 360-753-1487. Apr ual Spr ing Meeting at the Gifford Pinchot National Forest Headquarters in Vancouver,WA. Annual Spring Aprilil 25-26, 2007, SMC Ann For more information visit: http://www.standmgt.org. Apr m Forestr ual Meeting at the Red Lion Hotel and Conference Aprilil 26-28, 2007, Washington Far Farm Forestryy Association Ann Annual Center, Kelso,WA. For more information contact Rick Carter, 360-978-4434. August 7-10, 2007, Inter national Scientif ic Conf erence Forest Gro wth and Timber Quality: Cro wn Models and International Scientific Conference Growth Crown Sim ulation Methods ffor or Sustainab le Forest Management Doub letree Hotel, Por tland, OR. For more information Simulation Sustainable Doubletree ortland, please visit http://www.westernforestry.org/crownmodels/crownmodels.htm. College of Forest Resources University of Washington Box 352100 Seattle,WA 98195 9

