Natural Character in Hawke’s Bay: Application of the River Values Assessment System
advertisement
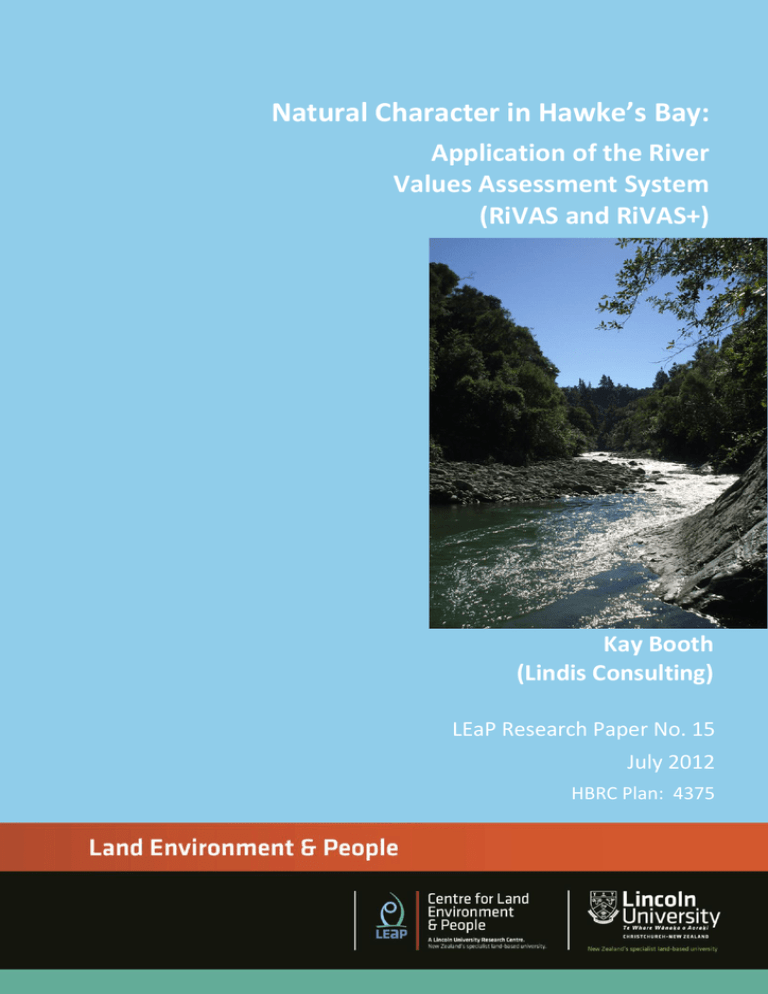
Natural Character in Hawke’s Bay: Application of the RiVAS Natural Character in Hawke’s Bay: Application of the River Values Assessment System (RiVAS and RiVAS+) Kay Booth (Lindis Consulting) LEaP Research Paper No. 15 July 2012 HBRC Plan: 4375 Natural Character in Hawke’s Bay: Application of the River Values Assessment System (RiVAS and RiVAS+) Kay Booth (Lindis Consulting) Land Environment and People Research Paper No. 15 July 2012 HBRC Plan No: 4375 ISSN 2230-4207 (online) ISBN 978-0-86476-304-4 (online) Lincoln University, Canterbury, New Zealand ©LEaP, Lincoln University, New Zealand 2012 Contacts - email: leap@lincoln.ac.nz web: http://www.lincoln.ac.nz/leap This information may be copied or reproduced electronically and distributed to others without restriction, provided LEaP, Lincoln University is acknowledged as the source of information. Under no circumstances may a charge be made for this information without the express permission of LEaP, Lincoln University, New Zealand. Series URL: http://hdl.handle.net/10182/3410 TABLE OF CONTENTS 1. INTRODUCTION ............................................................................................... 1 1.1 PURPOSE.......................................................................................................... 1 1.2 RIVER VALUES ASSESSMENT SYSTEM (RIVAS) ........................................................... 1 1.3 SUMMARY OF THIS ASSESSMENT ............................................................................. 2 2. APPLICATION OF THE RIVAS METHOD: CURRENT STATE OF RIVERS .................. 2 STEP 1: DEFINE THE RIVER VALUE, RIVER SITES AND LEVELS OF SIGNIFICANCE .............................. 2 STEP 2: IDENTIFY ATTRIBUTES ....................................................................................... 2 STEP 3: SELECT AND DESCRIBE PRIMARY ATTRIBUTES ........................................................... 3 STEPS 4 & 5: IDENTIFY INDICATORS AND DETERMINE INDICATOR THRESHOLDS ........................... 3 STEP 6: APPLY INDICATORS AND INDICATOR THRESHOLDS ..................................................... 3 STEP 7: WEIGHT THE PRIMARY ATTRIBUTES ...................................................................... 3 STEP 8: DETERMINE RIVER SIGNIFICANCE (CURRENT STATE) ................................................... 3 STEP 9: OUTLINE OTHER FACTORS RELEVANT TO THE ASSESSMENT OF SIGNIFICANCE ..................... 3 3. APPLICATION OF THE RIVAS+ METHOD: POTENTIAL FUTURE STATE OF RIVERS 5 STEP 10: IDENTIFY RIVERS AND INTERVENTIONS ................................................................. 5 STEP 11: APPLY INDICATORS AND INDICATOR THRESHOLDS FOR POTENTIAL VALUE....................... 5 STEP 12: WEIGHT THE PRIMARY ATTRIBUTES FOR POTENTIAL VALUE ........................................ 5 STEP 13: DETERMINE RIVER POTENTIAL VALUE................................................................... 5 4. REVIEW ........................................................................................................... 6 STEP 14: REVIEW ASSESSMENT PROCESS AND IDENTIFY FUTURE INFORMATION REQUIREMENTS ...... 6 REFERENCES CITED ................................................................................................ 7 APPENDICES 1: CREDENTIALS OF THE EXPERT PANEL MEMBERS AND ADVISORS ................................................. 8 2: ASSESSMENT CRITERIA FOR NATURAL CHARACTER (STEPS 2-4) ................................................. 9 3: ASSESSMENT OF INDICATORS BY SMARTA CRITERIA ............................................................ 14 4: SIGNIFICANCE ASSESSMENT CALCULATIONS FOR NATURAL CHARACTER, HAWKE’S BAY (STEPS 1, 5-8 AND 10-13) .................................................................................................................... 15 i LIST OF TABLES Table 1: Summary of the River Values Assessment System method............................ 1 LIST OF FIGURES Figure 1: Hawkes Bay natural character rivers mapped by significance level .............. 4 ii Natural Character in Hawke’s Bay: Application of the RiVAS 1. INTRODUCTION 1.1 PURPOSE This report presents the results from an application of the River Values Assessment System (RiVAS) for natural character in the Hawke’s Bay Region. A workshop was held on 12 December 2011 to apply the method to Hawke’s Bay rivers. 1.2 RIVER VALUES ASSESSMENT SYSTEM (RIVAS) Hughey and Baker (2010) describe the RiVAS method including its application to natural character. Table 1 provides a summary of the method. Table 1: Summary of the River Values Assessment System method Step Purpose 1 Define river value categories and river segments The river value may be subdivided into categories to ensure the method is applied at a meaningful level of detail. Rivers are listed and may be subdivided into segments or aggregated into clusters to ensure that the rivers/segments being scored and ranked are appropriate for the value being assessed. A preliminary scan of rivers in the region is undertaken to remove those rivers considered to be of ‘no’ or less-than-local level significance for the value being considered. 2 Identify attributes All attributes are listed to ensure that decision-makers are cognisant of the various aspects that characterise the river value. 3 Select and describe the primary attributes A subset of attributes (called primary attributes) is selected and described. 4 Identify indicators An indicator is identified for each primary attribute using SMARTA criteria. Quantitative criteria are used where possible. 5 Determine indicator thresholds Thresholds are identified for each indicator to convert indicator raw data to ‘not present’, ‘low’, ‘moderate’, ‘high’ (scores 0-3). 6 Apply indicators and indicator thresholds Indicators are populated with data (or data estimates from an expert panel) for each river. A threshold score is assigned for each indicator for each river. 7 Weight the primary attributes Primary attributes are weighted. Weights reflect the relative contribution of each primary attribute to the river value. The default is that all primary attributes are weighted equally. 8 Determine river significance Indicator threshold scores are summed to give a significance score (weightings applied where relevant). Rivers are ordered by their significance scores to provide a list of rivers ranked by their significance for the river value under examination. Significance (national, regional, local) is assigned based on a set of criteria or cut off points. 9 Outline other relevant factors Factors which cannot be quantified but influence significance are recorded to inform decision-making. 1 Natural Character in Hawke’s Bay: Application of the RiVAS Step Purpose 10 - Apply to Optional stage (RiVAS+). 13 potential river Relevant steps are repeated for potential future river conditions. scenarios (called RiVAS+) 14 1.3 Identify information requirements Data desirable for assessment purposes (but not currently available) are listed to inform a river value research strategy. SUMMARY OF THIS ASSESSMENT The Expert Panel (see Appendix 1) used eight resource attributes to assess 46 river reaches in the Hawke’s Bay Region for their natural character. The method was applied to differentiate river reaches of high natural character (n=14), moderate natural character (n=20), and low natural character (n=12). Few data were available, so the Expert Panel relied on their own assessments for most attributes. The RiVAS+ methodology was also applied to six river reaches to assess their future potential value for natural character; this was the first application of RiVAS+ to natural character and was treated as a trial application. The assessment suggested that two river reaches could be of moderate significance (rather than low significance in their existing state) if identified management actions were taken to enhance the river, and one river unit would shift from moderate significance (in its current state) to high significance. 2. APPLICATION OF THE RIVAS METHOD: CURRENT STATE OF RIVERS STEP 1: DEFINE THE RIVER VALUE, RIVER SITES AND LEVELS OF SIGNIFICANCE It was accepted that natural character is a term used to describe the naturalness of river environments, that it has both ecological and landscape connotations, and that the following definition is useful (Hughey and Baker, 2010, chapter 11, p1): Natural character is a term used to describe the naturalness of river environments. The degree or level of natural character within an area depends on: 1. The extent to which natural elements, patterns and processes occur; and 2. The nature and extent of modifications to the ecosystems and landscape/ riverscape. The highest degree of natural character (the greatest naturalness) occurs where there is least modification. The effect of different types of modification upon the natural character of an area varies with the context and may be perceived differently by different parts of the community. Rivers were clumped as appropriate (typically smaller catchments flowing directly to the sea) and split where appropriate, especially in large catchments with multiple land uses and land tenures, and major geographical differences. This resulted in a list of 46 river units (Appendix 4). STEP 2: IDENTIFY ATTRIBUTES Attributes to describe natural character are presented in Appendix 2. These were adopted from the most recent application of RiVAS for natural character (Tasman District – Martin et al. 2010). 2 Natural Character in Hawke’s Bay: Application of the RiVAS STEP 3: SELECT AND DESCRIBE PRIMARY ATTRIBUTES Primary attributes are those attributes selected to represent natural character within the RiVAS method. These were adopted from the most recent application of RiVAS for natural character (Tasman District – Martin et al. 2010). Appendix 2 describes the eight primary attributes (in bold). STEPS 4 & 5: IDENTIFY INDICATORS AND DETERMINE INDICATOR THRESHOLDS The indicators adopted to measure each primary attribute are presented in Appendix 2, together with their thresholds, and indicators are assessed against SMARTA criteria in Appendix 3. Indicators and thresholds were adopted from the most recent application of RiVAS for natural character (Tasman District – Martin et al. 2010). STEP 6: APPLY INDICATORS AND INDICATOR THRESHOLDS Expert Panel estimates were required for all indicators (Appendix 4). STEP 7: WEIGHT THE PRIMARY ATTRIBUTES The decision was made to keep weights equal (Appendix 4). STEP 8: DETERMINE RIVER SIGNIFICANCE (CURRENT STATE) The spreadsheet was used to sum the indicator threshold scores for each river reach (Appendix 4). The significance thresholds from the most recent application of RiVAS for natural character (Tasman District – Martin et al. 2010) were applied, but were converted (see Appendix 2 for a further explanation of this process) to the 3-point scale of ‘high’, ‘moderate’ and ‘low’ natural character (Appendix 4 and Figure 1). As a result, river reaches were identified as having high natural character (n=14), moderate natural character (n=20), and low natural character (n=5). STEP 9: OUTLINE OTHER FACTORS RELEVANT TO THE ASSESSMENT OF SIGNIFICANCE No discussion took place on other factors. 3 Natural Character in Hawke’s Bay: Application of the RiVAS Figure 1: Hawkes Bay natural character rivers mapped by significance level 4 Natural Character in Hawke’s Bay: Application of the RiVAS 3. APPLICATION OF THE RIVAS+ METHOD: POTENTIAL FUTURE STATE OF RIVERS STEP 10: IDENTIFY RIVERS AND INTERVENTIONS Six river units were assessed for their potential value for natural character (RiVAS+ assessment - see Appendix 4). This was the first application of RiVAS+ for natural character and it was treated as a trial. A variety of different types of rivers (urban, rural, coastal) were selected for testing purposes. The Expert Panel discussed the apparent oxymoron, whereby natural character is defined in terms of the degree of human modification and, by definition, interventions are human modifications. The Panel treated the interventions as a means to restore or enhance naturalness (i.e., the focus was on the end rather than the means). The list of possible interventions was adopted from the most recent application of RiVAS (see ‘Interventions’ sheet in Appendix 4). The Expert Panel identified one additional intervention ‘(3h) Create a natural channel’. This was added to the list of interventions (‘Interventions’ sheet in Appendix 4) and indicated in blue font. STEP 11: APPLY INDICATORS AND INDICATOR THRESHOLDS FOR POTENTIAL VALUE Taking each of the six river units in turn, the Expert Panel considered which interventions were relevant to that river and listed them (Appendix 4). The RiVAS+ method calls for the Panel to select the two most important interventions for each river; however, the Panel listed all those that were worthy of consideration. These were practical and feasible interventions rather than the ideal (e.g., it was assumed that roads could not be removed). Discussion confirmed that this assessment (RiVAS+) was about enhancement; maintenance or protection of existing values pertained to the earlier existing state assessment (RiVAS). It was noted that the interventions may need to take place upstream rather than in the river unit being assessed (e.g., to enhance water quality). Then the Panel considered the net effect of these interventions upon the natural character value of the river unit, and new scores were recorded for each attribute (Appendix 4). STEP 12: WEIGHT THE PRIMARY ATTRIBUTES FOR POTENTIAL VALUE Because equal weighting was used for the current state RiVAS assessment, equal weighting was also applied to this potential state assessment (RiVAS+). STEP 13: DETERMINE RIVER POTENTIAL VALUE The scores were summed for each river (Appendix 4). Assuming successful implementation of the identified interventions, the assessment indicates that two of the six river units would shift from low significance (in their current state) to moderate significance. Four river units would remain the same. Interventions most frequently identified as a means to enhance natural character were: increase minimum flow, control weeds (in-stream, including active river bed), plant riparian native vegetation, and create a natural channel. Because this was an illustrative exercise using only a few selected rivers, a more rigorous analysis of interventions is not warranted. 5 Natural Character in Hawke’s Bay: Application of the RiVAS 4. REVIEW STEP 14: REVIEW ASSESSMENT PROCESS AND IDENTIFY FUTURE INFORMATION REQUIREMENTS Few data were available to inform this case study. No other matters arose in relation to this work. 6 Natural Character in Hawke’s Bay: Application of the RiVAS REFERENCES CITED Hughey, K.F.D., Baker, M‐A. (eds). (2010). The River Values Assessment System: Volume 1: Overview of the Method, Guidelines for Use and Application to Recreational Values. LEaP Report No.24A, Lincoln University, New Zealand. Martin, D., Deans, N., Brown, S., Stuart, B., Doyle, M. and Hughey, K. (2010). Part B: Natural Character in Tasman District: Application of the River Values Assessment System (RiVAS), in Hughey, K.F.D., Baker, M‐A. (eds). (2010). The River Values Assessment System: Volume 2: Application to cultural, production and environmental values. LEaP Report No.24B, Lincoln University, New Zealand. Chapter 11: p20-32. 7 Natural Character in Hawke’s Bay: Application of the RiVAS APPENDIX 1: CREDENTIALS OF THE EXPERT PANEL MEMBERS AND ADVISORS The Expert Panel comprised five members. Their credentials are: 1. Gary Clode manages the engineering section of the Hawke’s Bay Regional Council and has 22 years experience with the Council dealing with the region’s rivers. He is responsible for flood control, gravel/sediment management, ecological management, and enhancement of the river and stream environment. Gary has been involved with a similar multi-value analysis of Napier waterways. 2. Peter Davis has undertaken field hydrology work for the Hawke’s Bay Regional Council for 24 years. 3. Sandy Haidekker is a freshwater scientist with the Hawke’s Bay Regional Council. She has responsibility for analysing water quality and ecological data in Hawke’s Bay catchments, and has classified the rivers on the basis of their natural characteristics. 4. Tim Sharp is a Strategic Policy Advisor for the Hawke’s Bay Regional Council where he coordinates the RiVAS programme for Council. He has an environmental management background, specialising in resource management to assess and support community values. 5. Thomas Winlove has been a Fish and Game Officer in the Hawke’s Bay Region for four years. He has undertaken fisheries projects and research over that time, as well as being an angler for over 10 years. Advisors: 1. Kay Booth is a researcher and planner, and the Director of Lindis Consulting. Kay has been involved in developing the RiVAS tool since its inception in 2007, and has applied RiVAS to various river values for several regional councils. 2. Chris Reed is a Senior Planner with the Hawke’s Bay Regional Council. He has worked on several RiVAS assessments for the Hawke’s Bay Regional Council. 8 Natural Character in Hawke’s Bay: Application of the RiVAS APPENDIX 2: ASSESSMENT CRITERIA FOR NATURAL CHARACTER (STEPS 2-4) Note – the following table was first established using a scoring system of 1 (very highly modified) to 5 (very highly natural). We have maintained this scoring system but then converted all values to: 5 or 4 =3 3 =2 1 or 2 =1 The original data are held by the Hawke’s Bay Regional Council and by the author. ATTRIBUTE CLUSTERS ATTRIBUTE (primary attributes in bold) Step 2: Identify attributes Step 3: Select and describe primary attributes River channel 1 Channel shape 1 DESCRIPTION OF PRIMARY ATTRIBUTES INDICATORS INDICATOR SIGNIFICANCE THRESHOLDS Step 3: Select and describe primary attributes Step 4: Identify indicators Step 5: Determine significance thresholds Modification to cross section (e.g., slopebanks) and long section (e.g., cut through meanders) .This also includes changes to a river bed width (e.g., narrowing of the channel), which is commonly undertaken in modified rivers with valuable land adjacent. Changes to the bed sediment should also be taken account of in this attribute. Aerial photographs, river cross sections, changes in river width/ length and water allocation resource consents (where available). Judgement from Expert Panel was also required due to limited available data for all rivers. Judgement made on a five-point scale: 1= Very Highly modified river, (i.e., straightened and channelised, often with concrete or rock fill banks) often within an urban context; 2= A highly modified channel shape or width but with semi natural reaches or channel shapes in some areas; 3= A river displaying a patchwork with moderate natural channel shape in places together with many human influences such as long stretches of stopbanks, groynes; 4= A highly natural river displaying occasional pockets or individual minor modifications to its channel shape (i.e., small stopbanks or groynes); Upon completion of RiVAS, the five point scale was converted to a three point scale to provide a consistent metric with other RiVAS assessments. 9 DATA SOURCES (AND RELIABILITY) Regional council, NIWA or other water quality data [i.e., GIS data]. Aerial photography. Natural Character in Hawke’s Bay: Application of the RiVAS ATTRIBUTE CLUSTERS ATTRIBUTE (primary attributes in bold) DESCRIPTION OF PRIMARY ATTRIBUTES INDICATORS INDICATOR SIGNIFICANCE THRESHOLDS 1 DATA SOURCES (AND RELIABILITY) 5= A very highly natural river with no modifications to its channel shape. Degree of modification of flow regime Hydrological information on a river’s low, median and mean flows assist in determining natural character. Substantial flow that appears to fit the nature and scale of the channel may suggest a higher degree of natural character. Dewatered bed or ‘misfit’ flows suggest upstream diversions, which reduce natural character. Change to natural flow regime. % Flow rate modification (would show low flows). Would need to know the flow data for each river. Expert Panel judgement based on quantitative data available. Judgement made on a five-point scale: 1= Very highly modified or diverted flow/ water-take (e.g., large-scale dams; take averaging 50% or more of median flow) 2= Highly modified or diverted flow (e.g., small-scale dams, irrigation or flood channels); 3= Moderately modified or diverted flow (e.g., several irrigation takes taking a moderate proportion of MALF); 4= Relatively low levels of modified or diverted flow (e.g., few irrigation takes taking minor proportion (<5%) of low flow); 5= Highly natural flow regime with no modifications to the flow pattern. Regional council, NIWA or other water quality data. Water quality Perception of the water quality, especially its clarity, colour, etc. Information from council or other parties. Also judgement from Expert Panel taking account of visual and biological aspects where they apply, particularly water clarity, nutrient content, temperature, salinity and faecal coliforms. Judgement made on a five point scale: 1= Very highly contaminated or permanently discoloured water displaying very high levels of human-induced changes to the water quality with limited life supporting capacity (e.g., within polluted urban/ industrialised areas or intensive farming); 2= Water usually displaying high levels of contamination mainly from adjacent diffuse sources from land use activities (agricultural leaching, etc.); 3= Water displaying reasonable levels of naturalness although contains occasional high-moderate levels of human induced changes to part of the waterway or at some times; 4= Water displaying relatively high levels of water Regional council, NIWA or other water quality data. 10 Natural Character in Hawke’s Bay: Application of the RiVAS ATTRIBUTE CLUSTERS ATTRIBUTE (primary attributes in bold) DESCRIPTION OF PRIMARY ATTRIBUTES INDICATORS INDICATOR SIGNIFICANCE THRESHOLDS 1 DATA SOURCES (AND RELIABILITY) quality with small or rare amounts of impurities caused further upstream (e.g., by occasional stock crossing or forest harvesting); 5= Highly natural water quality displaying no human induced changes. Exposed riverbed Extent of the exposed bed appropriate for river type (and flows) would assume higher natural character than one with unexpected areas of exposed bed not relating to flows. Not all river types have exposed areas; depends on flow regime and nature of the channel. Also, difficult to judge for a braided river. Bed material substrate Exposed bed material appropriate for river type (i.e., size, geology for type of flow). Visible geological make-up of the river substrate/ bed. Expert Panel judgement. Exotic ‘aquatic’ flora and fauna within the river channel Presence of aquatic flora and fauna within the river channel (including waterweeds, pest fish (which include trout and salmon), the eggs and fry of pest fish, and the invasive alga, e.g. didymo) can reduce the natural character of the river. This does not include vegetation on ‘islands’ within the river channel. This is contained under ‘riparian vegetation’. Algal bloom may be evident in some rivers due to seasonal low flows. Expert ecological judgement will be required to assess extent and may have a bearing on the degree of naturalness of this primary attribute. Expert Panel judgement, looking at volume, variety. 11 Judgement based on a five-point scale: 1= River system choked with exotic aquatic flora and fauna; 2= Large areas of introduced flora and fauna (including pest fish) evident (in approximately 75% of river); 3= Occasional stretches (some quite long) of introduced flora and fauna evident within waterway (approx. 50% of river); 4= Small, often isolated pockets of introduced flora and fauna evident(less than 20% of total river), however river displaying very high levels of naturalness; 5= No evidence of introduced flora or fauna within the water channel. Regional council, NIWA or other water quality data. Natural Character in Hawke’s Bay: Application of the RiVAS ATTRIBUTE CLUSTERS Riparian Edge ATTRIBUTE (primary attributes in bold) DESCRIPTION OF PRIMARY ATTRIBUTES INDICATORS INDICATOR SIGNIFICANCE THRESHOLDS 1 DATA SOURCES (AND RELIABILITY) Structures and human modifications within the river channel Including dams, groynes, stopbanks, diversions, gravel extractions which may affect the level of natural character of the river channel. Expert Panel judgement based on knowledge of river, assisted by aerial photos, council GIS, REC and LCDB. Linear measurement/ % proportion of human modification. Judgement based on a five-point scale: 1= River channel completely modified or artificial (i.e., dam/ weir/ flood defence structure); 2= Significant parts of the river channel have been affected or encroached upon by human intervention (i.e., a suburban/ highly managed agricultural land, including: gravel workings, part-channelisation); 3= Occasional ‘reaches’ of human modifications (i.e., a settled rural landscape with bridge/ aqueduct supports, pylon footing); 4= Limited human intervention (i.e., occasional bridge abutments/ power pole within the river channel); 5= Overwhelmingly natural with no/ very limited evidence of human interference. Regional council, NIWA or other water quality data. Vegetation cover in the riparian edge Dominance of native communities in natural patterns (the presence of exotic species in natural patterns will reduce natural character but is of higher naturalness than the absence of such vegetation (unless this is natural) or the presence of planted vegetation). This includes all bankside vegetation as well as vegetation within ‘islands’, such as those within braided river systems. Vegetation comprises all types, including grasses, remnant scrub, shrubs and trees. In some instances, the natural elements and patterns indicate limited vegetation (i.e., high country rivers), where native Proportion of native vegetation against other vegetation. Extent to which river processes have generated natural vegetation patterns. Expert Panel judgement based on REC (LCDB) and aerial photographs to assist in determining vegetation cover. Judgement based on a five point scale: 1= Complete absence of vegetation due to humaninduced changes (or limited presence (in pockets) of exotic vegetation such as occasional willow, gorse or buddleia); 2= Exotic vegetation with complete absence of native species within a pastoral/ semi urban setting; 3= Predominantly exotic vegetation in natural patterns (i.e., willows/ gorse) and/ or patches of remnant indigenous vegetation; 4= Fragmented areas of native and exotic vegetation in natural patterns. Predominance of native vegetation; 5= Overwhelmingly indigenous vegetation with no or few introduced species. River Environment Classification system (REC), developed by NIWA (good). 12 Natural Character in Hawke’s Bay: Application of the RiVAS ATTRIBUTE CLUSTERS ATTRIBUTE (primary attributes in bold) DESCRIPTION OF PRIMARY ATTRIBUTES INDICATORS INDICATOR SIGNIFICANCE THRESHOLDS 1 DATA SOURCES (AND RELIABILITY) grasses or herbs are the only form of vegetation in the area. Wider landscape character Extent of exotic flora Proliferation of exotic flora. % of exotic vegetation on REC (LCDB). Structures and human modifications in the riparian edge Include bridges, roads. All potentially impact on the naturalness of a river. An absence of human modifications. However minor, structures particularly if constructed from natural or local materials may not influence natural character greatly, but will have a localised effect. The scale and nature of modifications will influence the effect on natural character. Expert Panel judgement with potential to base it on LCDP and REC GIS layers. Linear measurement/ Number of structures. Judgement based on a five-point scale: 1= Major modification to the riparian edge (i.e., dam/ weir/ flood defence structure); 2= Significant parts of the riparian edge have been affected by human intervention (i.e., a suburban/ highly managed agricultural land, including: gravel workings, part-channelisation, marinas); 3= Occasional ‘pockets’ of human modifications (i.e., a settled rural landscape with bridge/ aqueduct supports, boathouses); 4= Limited human intervention (i.e., occasional bridge/ power pole/ jetty); 5= Overwhelmingly natural with no/ very limited evidence of human interference. River Environment Classification system (REC), developed by NIWA (good); Aerial photos LCDP (good). Character modifications Broader scale landscape modification beyond the immediate river margin, leaching from agricultural land, intensification of land use all impact on natural character. Protected natural areas such as reserves, parks and estates managed by DoC indicate a higher natural character. Catchment modifications if ecologically or visually linked to the waterway. Expert Panel judgement based on intensification of land use adjacent to river (includes more distant views beyond the river banks). Expert Panel to rank from indigenous bush to urban scenarios. Use of LCDB and Landscape Assessments to inform decision. Judgement based on a five-point scale: 1= Heavily modified landscape (urban or highly intensive setting) with limited vegetation; 2= Suburban/ highly managed agricultural landscape; 3= Settled pastoral landscape with areas of commercial forestry and pockets of indigenous vegetation; 4= Fragmented indigenous and rural landscape including a few areas of commercial exotic forestry; 5= Overwhelmingly indigenous landscape with no or very little human modification. District or regional wide Landscape Assessments 13 Natural Character in Hawke’s Bay: Application of the RiVAS APPENDIX 3: ASSESSMENT OF INDICATORS BY SMARTA CRITERIA Indicator Specific Measurable Achievable Relevant Timely Already in use Channel shape Yes Expert judgement. Overlay of aerial photos or earlier maps, where available Potential data available Known to influence river’s naturalness Potential data available Not known Degree of modification of flow regime Yes Current minimum flow/ natural MALFwould show low flows Data available for most rivers in proportion to river’s use Known to influence river’s naturalness Data usually already available Not known Water quality Yes Information from councils or others Potential data available Known to influence river’s naturalness Data already available Not known Exotic ‘aquatic’ flora and fauna within the river channel Yes % of native vegetation within 50m buffer from waterway – LCDB Data available Known to influence river’s naturalness Data available Not known Structures and human modifications within the river channel Yes Number of structures within waterway (dams) including dams, bridge abutments etc – water allocation resource consents and regional council GIS database available where possible Councils often hold such data One main indicator of natural character Data available Not known Vegetation cover within the riparian margin Yes % of native vegetation within 50m buffer from waterway – LCDB Data available One main indicator of natural character Data available Not known Structures and human modifications within the riparian margin Yes Number of structures along the waterway edges or % of modified banks, e.g., stopbanks – regional council GIS database available? Councils often hold such data One main indicator of natural character Data available Not known Character modifications Yes % of native vegetation in LCDB or REC* Data available Known to influence rivers naturalness Data available Not known 14 Natural Character in Hawke’s Bay: Application of the RiVAS APPENDIX 4: SIGNIFICANCE ASSESSMENT CALCULATIONS FOR NATURAL CHARACTER, HAWKE’S BAY (STEPS 1, 5-8 AND 10-13) Lake Waikaremoana tributaries 3 3 3 3 3 3 3 3 24 high Mohaka 3 3 3 3 3 3 3 3 24 high Tutaekuri upper (above and incl. Mangatutu) Ngaruroro upper (above Whanawhana cableway incl Taruarau) Makaroro 3 3 3 3 3 3 3 3 24 high 3 3 3 3 3 3 3 3 24 high 3 3 3 3 3 3 3 3 24 high Tukituki upper (above SH50) 3 3 3 3 3 3 3 2 23 high Ruakituri 3 3 3 3 3 3 2 2 22 high Mangapoike 3 3 3 3 3 2 3 2 22 high Hangaroa (Hawke's Bay only) 3 3 3 3 3 2 2 2 21 high Esk upper (above Mangakopikopiko) Makaretu 3 3 3 3 3 2 2 2 21 high 3 3 3 3 3 2 2 2 21 high Nuhaka upper (above Tunanui) 3 3 3 3 2 2 3 2 21 high 15 Wider Landscape Landscape character Structures/ human modification Riparian edge Structures/ human modification Absence of exotic flora/ fauna Water quality Sum Significance Intervention Flow regime River channel River shape Landscape character Structures/ human modification Extent of native flora Absence of exotic flora/ fauna Water quality Flow regime River shape River name Riparian Wider edge Landscape Structures/ human modification River channel Potential future river state (RiVAS+) Extent of native flora Current river state (RiVAS) Sum Shift Significance Natural Character in Hawke’s Bay: Application of the RiVAS Wairoa upper (above Frasertown) Waiau upper (above Owhio Stream) Mangaaruhe 3 3 2 3 3 2 3 2 21 high 3 2 3 3 2 3 2 3 21 high 3 3 2 3 3 2 2 2 20 moderate Kauhauroa 3 3 2 3 3 2 2 2 20 moderate Waikaretaheke 3 1 3 3 2 3 2 3 20 moderate Waiau lower (below Owhio Stream) Tukituki middle/upper (SH50 to Waipukurau incl. tribs) Waipawa 3 1 3 3 2 3 2 3 20 moderate 3 2 3 3 3 2 2 2 20 moderate 3 2 3 3 3 2 2 2 20 moderate Ngaruroro middle (below Whananana; above and incl. Maraekakaho, Poporangi) Waikari/ Anaura 3 3 3 3 2 2 2 2 20 moderate 3 3 2 2 3 2 2 2 19 moderate Aropaouanui/ Waikoau/ Moeangiangi Esk lower (below and incl. Mangakopikopiko) Mangaonuku 3 3 2 2 3 2 2 2 19 moderate 3 3 2 2 3 2 2 2 19 moderate 3 2 2 3 3 2 2 2 19 moderate Tukipo/ Mangatewai/ Avoca 3 2 2 3 3 2 2 2 19 moderate Tutaekuri middle (below Mangatutu; above and incl Mangaone & other tribs) Southern Coastal streams 3 3 2 3 2 2 2 2 19 moderate 3 3 2 2 3 2 2 2 19 moderate Maraetotara upper 3 3 2 2 2 2 2 2 18 moderate Porangahau (incl Huatokitoki) 3 3 1 2 3 2 2 2 18 moderate 6c,7a-d 3 3 2 2 3 3 2 2 20 2 moderate Tukituki middle (below Waipukurau incl. tribs; above Havelock North) Tahaenui Stream 3 2 2 2 2 2 2 2 17 moderate 7a-d 3 2 3 3 2 2 2 2 19 2 moderate 3 3 2 2 2 1 1 2 16 moderate Waimauru 3 3 2 2 2 1 1 2 16 moderate 16 Natural Character in Hawke’s Bay: Application of the RiVAS Nuhaka (below Tunanui) 3 3 2 2 2 1 1 2 16 moderate Tukituki lower (below Havelock North) Maraetotara lower 2 2 2 2 2 1 1 2 14 low 2 2 2 2 2 1 1 2 14 low Ngaruroro lower (below Maraekakaho) Opoutama stream 2 2 2 2 2 1 1 2 14 low 3 3 1 1 1 1 1 2 13 low Kopuawhara stream 3 3 1 1 1 1 1 2 13 low Tutaekuri-Waimate Stream 2 1 1 1 2 1 1 2 11 low Lower Tutaekuri (below Mangaone) Upper (Poukawa, Awanui, Karewarewa, Irongate) Havelock stms (Mangarau, Here Here, Karituwhenua, Tekahika, School ) Lower (Ruahapia, Raupare, Southland, Awahou) Clive, Muddy Creek 2 1 1 1 2 1 1 2 11 low 2 1 1 1 2 1 1 2 11 low 2a,3c,3h,6c 3 2 2 2 2 2 1 2 16 5 moderate 1 1 1 2 1 1 1 1 9 low 2a,3c,3h,6c 2 2 2 3 1 2 1 1 14 5 low 1 1 1 1 2 1 1 1 9 low 2a,3c,3h,6c 2 1 2 2 2 2 1 1 13 4 low 1 1 1 1 2 1 1 1 9 low Taipo, Saltwater Creek, Purimu 1 1 1 1 1 1 1 1 8 low 2a,3c,3h,6c 3 3 2 3 1 3 1 1 17 9 moderate Key to attributes scores: 1= Highly to Very highly modified (low degree of natural character) 2= Moderately modified (moderate degree of natural character) 3= Low to Very Low or no modification (high degree of natural character) Colour Code Key (as at 28 May 2012) Significance thresholds (highlighted columns) Green High = National Blue Moderate = Regional Yellow Low = Local 17 Natural Character in Hawke’s Bay: Application of the RiVAS Misc (highlighted rivers) Pink Rivers overlap with neighbouring council Data reliability (font colour) Blue/Purple Less reliable data Red Data checked by Expert Panel and has been adjusted RiVAS+ (highlighted rows) Blue Also assessed for potential future state (RiVAS+) Orange Score changed by proposed interventions (RiVAS+) Green Positive influence on attribute but not enough to shift value - counted as an increase of 0.5 (RiVAS+) 18
