Mobile Crowd-Sensing Wireless Activity with Measured Interference Power
advertisement
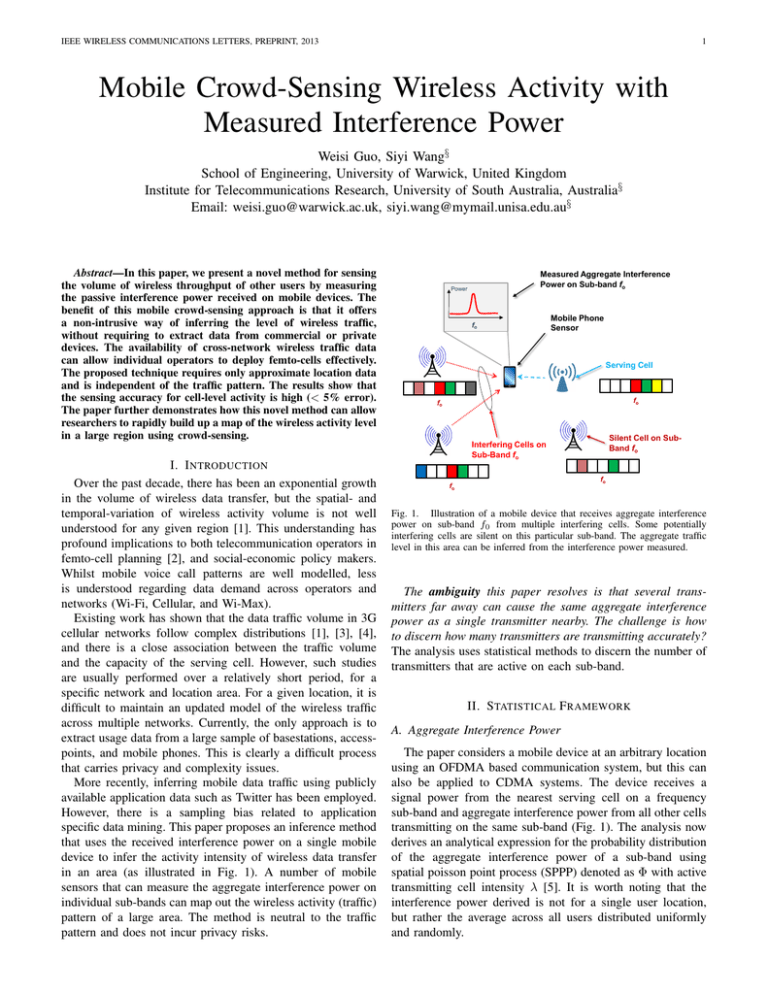
IEEE WIRELESS COMMUNICATIONS LETTERS, PREPRINT, 2013 1 Mobile Crowd-Sensing Wireless Activity with Measured Interference Power Weisi Guo, Siyi Wang§ School of Engineering, University of Warwick, United Kingdom Institute for Telecommunications Research, University of South Australia, Australia§ Email: weisi.guo@warwick.ac.uk, siyi.wang@mymail.unisa.edu.au§ Abstract—In this paper, we present a novel method for sensing the volume of wireless throughput of other users by measuring the passive interference power received on mobile devices. The benefit of this mobile crowd-sensing approach is that it offers a non-intrusive way of inferring the level of wireless traffic, without requiring to extract data from commercial or private devices. The availability of cross-network wireless traffic data can allow individual operators to deploy femto-cells effectively. The proposed technique requires only approximate location data and is independent of the traffic pattern. The results show that the sensing accuracy for cell-level activity is high (< 5% error). The paper further demonstrates how this novel method can allow researchers to rapidly build up a map of the wireless activity level in a large region using crowd-sensing. Measured Aggregate Interference Power on Sub-band fo Power fo Mobile Phone Sensor Serving Cell fo fo Silent Cell on SubBand fo Interfering Cells on Sub-Band fo I. I NTRODUCTION Over the past decade, there has been an exponential growth in the volume of wireless data transfer, but the spatial- and temporal-variation of wireless activity volume is not well understood for any given region [1]. This understanding has profound implications to both telecommunication operators in femto-cell planning [2], and social-economic policy makers. Whilst mobile voice call patterns are well modelled, less is understood regarding data demand across operators and networks (Wi-Fi, Cellular, and Wi-Max). Existing work has shown that the data traffic volume in 3G cellular networks follow complex distributions [1], [3], [4], and there is a close association between the traffic volume and the capacity of the serving cell. However, such studies are usually performed over a relatively short period, for a specific network and location area. For a given location, it is difficult to maintain an updated model of the wireless traffic across multiple networks. Currently, the only approach is to extract usage data from a large sample of basestations, accesspoints, and mobile phones. This is clearly a difficult process that carries privacy and complexity issues. More recently, inferring mobile data traffic using publicly available application data such as Twitter has been employed. However, there is a sampling bias related to application specific data mining. This paper proposes an inference method that uses the received interference power on a single mobile device to infer the activity intensity of wireless data transfer in an area (as illustrated in Fig. 1). A number of mobile sensors that can measure the aggregate interference power on individual sub-bands can map out the wireless activity (traffic) pattern of a large area. The method is neutral to the traffic pattern and does not incur privacy risks. fo fo Fig. 1. Illustration of a mobile device that receives aggregate interference power on sub-band f0 from multiple interfering cells. Some potentially interfering cells are silent on this particular sub-band. The aggregate traffic level in this area can be inferred from the interference power measured. The ambiguity this paper resolves is that several transmitters far away can cause the same aggregate interference power as a single transmitter nearby. The challenge is how to discern how many transmitters are transmitting accurately? The analysis uses statistical methods to discern the number of transmitters that are active on each sub-band. II. S TATISTICAL F RAMEWORK A. Aggregate Interference Power The paper considers a mobile device at an arbitrary location using an OFDMA based communication system, but this can also be applied to CDMA systems. The device receives a signal power from the nearest serving cell on a frequency sub-band and aggregate interference power from all other cells transmitting on the same sub-band (Fig. 1). The analysis now derives an analytical expression for the probability distribution of the aggregate interference power of a sub-band using spatial poisson point process (SPPP) denoted as Φ with active transmitting cell intensity λ [5]. It is worth noting that the interference power derived is not for a single user location, but rather the average across all users distributed uniformly and randomly. IEEE WIRELESS COMMUNICATIONS LETTERS, PREPRINT, 2013 2 Consider the particular value Ir of random variable (R.V.) IR denoted as the aggregate interference power received at the mobile device: X hi P Λri−α , Ir = (1) i∈Φ i6=l where hi is the multi-path fading gain, l is the serving cell index in SPPP Φ, P is the transmit power and is assumed to be same for all cells, Λ is the pathloss constant, ri is the distance from interfering transmitter to receiver, and α is the pathloss exponent [6]. The letters will denote R.V. as capital letters and particular values as lower-case letters. The paper considers Rayleigh fading with mean 1 and defines R.V. G = HP Λ, which therefore follows the exponential distribution with mean β denoted by G ∼ exp(β), where β = 1/P Λ. The moment generating function of IR is defined as follows: MIR (s) , E(esIr ) (Ir > 0). (2) of the aggregate interference power can be simplified to: ! π2 λ √ FIR (ζ; 4) = erfc , (7) 4 βζ and the PDF is simplified to: ! 32 π π 4 λ2 λ exp − . fIR (Ir ; 4) = √ 16βIr 4 β Ir It can be observed that the probability distributions have a tight relationship with the following parameters: • Active Cell Density λ: as the density increases, the expected interference power increases; • Transmit Power β ∝ P (Λ is a constant): as the transmit power increases, the expected interference power increases; which are both intuitive results and shown in Fig. 2. Since the Laplace transform of a function f (t), defined for all real numbers t > 0, is the function F (s), given by: Z +∞ F (s) , L [f (t)](s) = e−st f (t) dt, (3) MIR (−s; α) = L [fIR (Ir )](s) = E(e−sIr ), 2 2π 2 λ csc 2π s α α , = exp − α β (4) 1 P(Ir < ζ = 0.5) 0 Equation (2) evaluated at −s can be re-written as the Laplace transform of the PDF of IR : 0.8 0.6 0.4 0.2 0 10 0 1 20 2 30 where the full proof is given in the Appendix. Therefore, the probability density function (PDF) of IR is obtained on taking the inverse Laplace transform as: fIR (Ir ; α) = L −1 [MIR (−s)](Ir ), 2 2π α 2 2π λ csc α s (Ir ), = L −1 exp − α β 4 2 2 π λ csc ( 2π α ) π 3/2 λ csc 2π α exp − α2 βIr = . √ 3/2 α βIr (8) Transmit Power, W 4 x 10 3 40 4 Cell Density, cells per km2 Fig. 2. Probability of aggregate interference smaller than a certain value (IR < ζ), for varying values of cell density λ and cell transmit power P , from Eq.(7) with ζ = 0.5. (5) The cumulative density function (CDF) of IR is thus given by: Z ζ FIR (ζ; α) = fIR (Ir ; α) dIr 0 4 2 2 π λ csc ( 2π α ) Z ζ π 3/2 λ csc 2π exp − 2 α α βIr = dIr (6) √ 3/2 0 α βIr " # π 2 λ csc 2π α √ . = erfc α βζ The expectation of the interference power can be found using the complementary CDF: ! Z +∞ π2 λ √ E(IR (ζ; 4)) = erf dζ, (9) 4 βζ 0 but it does not converge absolutely. An easier average to find e which can be found by is the median interference power ζ, e 4) = 0.5: setting FIR (ζ; #2 " 2 π λ (10) ζe = √ . 4 βerfc−1 (0.5) In the next section, we estimate the wireless data transfer volume using the estimated interference power. III. W IRELESS ACTIVITY E STIMATION A. Theory B. Non-Line-of-Sight (NLOS) Environment In NLOS environments, the pathloss distance exponent is typically of a value α = 4 [6]. In this special case, the CDF The paper considers an OFDMA downlink network with a fixed deployment of co-frequency cells with density χ. Assuming a random uniform user distribution, then the maximum IEEE WIRELESS COMMUNICATIONS LETTERS, PREPRINT, 2013 3 Areal λf = 0. χ (11) Let us assume a mobile device measures a certain average aggregate interference power of ζ. Then the sensed activity level at that frequency band is given by combining Eq.(10) and Eq.(11): p 4 ζβerfc−1 (0.5) (12) Asensed = . π2 χ It is worth noting that the analysis has not resolved the ambiguity of which specific set of interference cells are actively transmitting. Instead, the stochastic analysis reveals the percentage of cells that are actively transmitting. The paper now considers a proof of concept demonstrator to compare theory with practice. paper first compares real simulated network activity level (A) with the sensed activity level (A0 ) for different number of interference power samples per sub-band and deployed cell densities. The results in Fig. 3 show that in order to achieve below 5% error with 2 cells per km2 , at least 40–50 samples per sub-band are needed. When shadow fading (variance 9 dB) is considered, the sensing errors compared to that of no fading is approximately 20% larger. Wireless Activity Sensing Error, % achievable throughput of a cell C can be found using MonteCarlo simulation or stochastic geometry methods [5], [6]. This is the fully loaded throughput where each sub-band radio resource is utilized. The load of a cell is defined as the ratio between the traffic demanded in a cell T and the maximum T . The average load of achievable throughput of a cell: L = C multiple cells is the activity level. Statistically, the load ratio L also corresponds to the proportion of sub-band radio resources utilized. Consider a particular transmission sub-band f0 , such that at any particular time, there are λf0 of the χ cells transmitting on the particular subband over a particular area (as shown in Fig. 1). Therefore, the paper defines the real network activity level on a particular sub-band as the ratio between actively transmitting cells and total deployed cells: 40 5 cells per km2, 0dB Shadow Fading 2 cells per km2, 0dB Shadow Fading 30 2 5 cells per km , 9dB Shadow Fading 2 cells per km2, 9dB Shadow Fading 20 10 0 0 10 20 30 40 No. of Interference Power Samples per Sub−band 50 Fig. 3. Sensing error as a function of number of interference power samples per sub-band and the deployed cell density χ. Figure 4 shows simulated real network activity and sensed network activity for 2 different times during the day with 50 samples per sub-band. Given that the average data-packet session of a user is approximately 6 seconds [1], the sensing time required is in the order of 5 minutes to obtain an accurate portrayal of the traffic model used. This sensing time can be divided amongst multiple sensors in a single cell coverage area. Provided that the sensor knows which cell it is served by, the mobility of the sensor is not an issue. Therefore, this crowd-sourcing of information can be performed by a number of smartphones with low resolution location information. B. Validation and Accuracy 1 TABLE I S IMULATION PARAMETERS FOR A 4G N ETWORK IN A T YPICAL M ETROPOLITAN A REA . Value OFDMA Downlink 1–10 per km2 9 km2 2.6 GHz 20 MHz 100 Urban Micro [6] 40 dB 4 Poisson [1] Rayleigh Log-normal 40 W 50 per sub-band 400 per km2 In the investigation, the simulation considers a realistic 4G network with deployment parameters given in Table I. The 0.8 Average Activity Level Parameter LTE Cellular System Deployed Cell Density, χ Coverage Area Transmission Frequency Transmission Bandwidth Number of Sub-bands Pathloss Model Frequency Dependent Pathloss, Λ Pathloss Distance Exponent, α User Arrival Process Data Demand per User Session Fading Gain, h Shadow Fading Transmit Power, P Sub-band Power Samples Location Samples Real Data Sensor Data 0.9 0.7 High Data Activity During Evening Time 0.6 Low Data Activity During Early Morning Time 0.5 0.4 0.3 0.2 1 2 3 4 5 6 7 8 9 10 Deployed Cell Density (χ), cells per km2 Fig. 4. Simulation of real network activity level (A) and sensed network activity level (A0 ) for different times during the day with varying network deployment density. As shown by (12), the estimation requires knowledge of certain parameters. The number of cells deployed χ can be treated as a relatively static parameter, which can be found using existing cell-site databases. The pathloss distance exponent α and pathloss constant β are statistical parameters derived from empirical measurements of certain pathloss scenarios [6]. IEEE WIRELESS COMMUNICATIONS LETTERS, PREPRINT, 2013 Whilst this is susceptible to non-uniform effects in propagation (shadow fading and antenna patterns), the results in the next section will show that statistical averaging of multiple readings can reduce the sensing errors. 4 method can allow researchers to rapidly build up a map of the wireless activity level in a large region through crowdsensing. The availability of cross-network wireless traffic data can allow operators to deploy femto-cells effectively and allow better understanding of the digital economy. C. Crowd Sensing The paper now considers a 25 km2 area, of which 18 cells are deployed in accordance to a Vodafone London network configuration. Over 10,000 uniform spatial samples are taken, where each spatial sample consists of 50 samples per sub-band over 100 sub-bands to yield a sensing error of less than 5%. Figure 5a shows the real simulated data based on a user arrival and data demand process [1]. It is worth stressing that the sensing technique is independent of the traffic model and the model in this paper is for demonstrative purposes. Fig. 5b shows the sensed activity data using Eq. (12). The errors due to non-linear effects are reduced by taking averages of the interference power. Fig. 5 shows that the sensing data can offer a sufficiently accurate understanding of how the traffic level varies both in space, and also in time (when this is re-sampled at another time interval). The resolution is poorer on the edge of Fig. 5 due to the lack of sensing data. Over the coarse of a longer period of time, one is able to obtain interesting statistics about the spatial- and temporaldistribution of wireless traffic. This study is beyond the scope of this paper, which only serves to introduce the possibility of this concept. The wider applications of understanding wide band wireless traffic patterns include sustainable small-cell deployment [7]. A PPENDIX The moment generating function of IR is: MIR (−s; α) = L [fIR (Ir )](s) = E(e−sIr ), X −α gi ri = EΦ EG exp − s , i∈Φ i6=l = EΦ Y EG exp − sgi ri−α , (13) i∈Φ i6=l = EΦ Y β . β + sri−α i∈Φ i6=l The next step follows from the i.i.d. distribution of G and its further independence from the SPPP Φ: −2πλ R +∞ 1− β β+sv −α v dv , MIR (−s; α) = e α2 Z +∞ s 1 , = exp −πλ α du β 1 + u2 0 2 2π 2 λ csc 2π s α α , = exp − α β 0 (14) where the last step follows from the probability generating functional (PGFL) [8] of the SPPP and the manipulation results from converting from Cartesian to polar coordinates 2 and the variable u is substituted for v 2 β/s α at the penultimate step above. R EFERENCES a) Real Network Activity Level b) Sensed Network Activity Level Fig. 5. Wireless data traffic activity rate for a particular period in time: a) Real simulated data based on a user arrival process in cells [1]; b) Sensed data using Eq. (12) and taking averages. IV. C ONCLUSIONS In this paper, we presented a novel method for sensing the volume of wireless activity at any frequency using the passive interference power. The benefit of this approach is that it offers a non-intrusive way of accurately inferring the level of wireless activity, without requiring to extract data from commercial operators or tapping each wireless device. The results show that given sufficiently accurate interference power measurements, the sensing accuracy for cell-level activity is high (< 5% error) across a wide range of cell density and activity levels. The paper further demonstrates how this novel [1] M. Laner, P. Svoboda, S. Schwarz, and M. Rupp, “Users in cells: a data traffic analysis,” in IEEE Wireless Communications and Networking Conference (WCNC), Apr. 2012, pp. 3063–3068. [2] W. Guo and S. Wang, “Interference-aware self-deploying femto-cell,” in IEEE Wireless Communications Letters, vol. 1, Nov. 2012, pp. 609–612. [3] M. Shafiq, L. Ji, A. Liu, J. Pang, and J. Wang, “Characterizing geospatial dynamics of application usage in a 3g cellular data network,” in Proceedings IEEE INFOCOM, 2012, pp. 1341–1349. [4] Y. Zhang and A. Arvidsson, “Understanding the characteristics of cellular data traffic,” in Proceedings ACM SIGCOM, 2012, pp. 13–18. [5] M. Haenggi, J. G. Andrews, F. Baccelli, O. Dousse, and M. Franceschetti, “Stochastic geometry and random graphs for the analysis and design of wireless networks,” in IEEE Journal on Selected Areas in Communications (JSAC), vol. 28, Sep. 2009, pp. 1029–1046. [6] 3GPP, “TR36.814 V9.0.0: Further Advancements for E-UTRA Physical Layer Aspects (Release 9),” 3GPP, Technical Report, Mar. 2010. [7] W. Guo and T. O’Farrell, “Capacity-Energy-Cost Tradeoff for Small-Cell Networks,” in Vehicular Technology Conference, IEEE, May 2012. [8] D. Stoyan, W. S. Kendall, J. Mecke, and L. Ruschendorf, Stochastic geometry and its applications. Wiley New York, 1987, vol. 2.
