1. The Experiment 2. MAANOVA - MicroArray ANalysis Of VAriance
advertisement

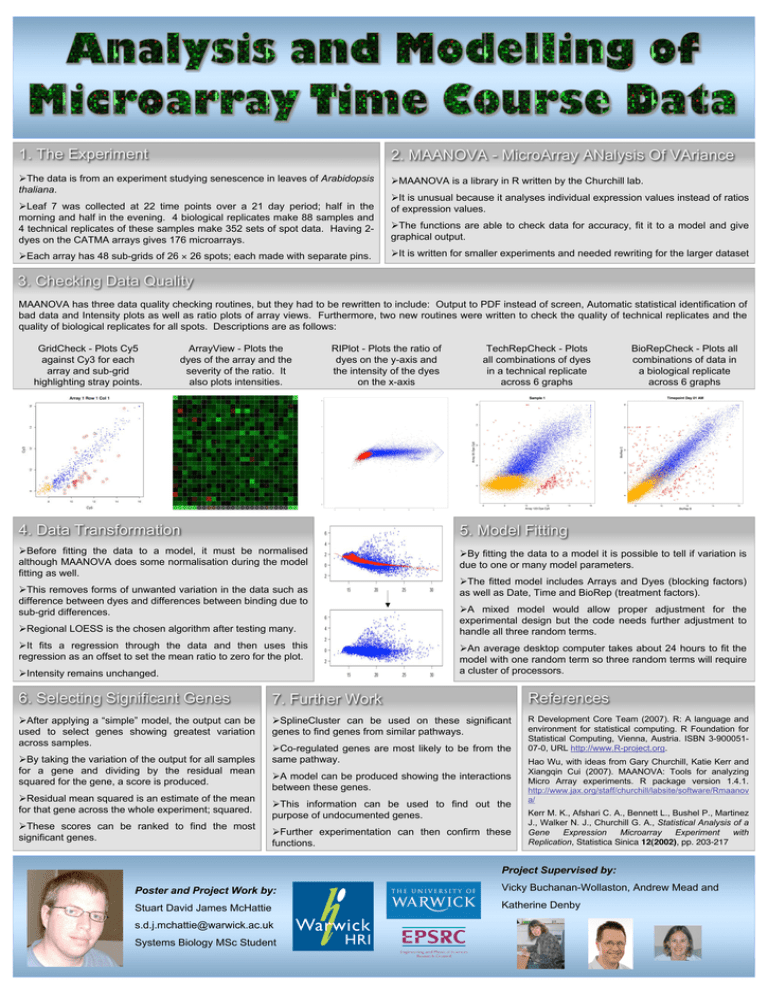
1. The Experiment 2. MAANOVA - MicroArray ANalysis Of VAriance !The data is from an experiment studying senescence in leaves of Arabidopsis thaliana. !MAANOVA is a library in R written by the Churchill lab. !Leaf 7 was collected at 22 time points over a 21 day period; half in the morning and half in the evening. 4 biological replicates make 88 samples and 4 technical replicates of these samples make 352 sets of spot data. Having 2dyes on the CATMA arrays gives 176 microarrays. !Each array has 48 sub-grids of 26 ! 26 spots; each made with separate pins. !It is unusual because it analyses individual expression values instead of ratios of expression values. !The functions are able to check data for accuracy, fit it to a model and give graphical output. !It is written for smaller experiments and needed rewriting for the larger dataset 3. Checking Data Quality MAANOVA has three data quality checking routines, but they had to be rewritten to include: Output to PDF instead of screen, Automatic statistical identification of bad data and Intensity plots as well as ratio plots of array views. Furthermore, two new routines were written to check the quality of technical replicates and the quality of biological replicates for all spots. Descriptions are as follows: GridCheck - Plots Cy5 against Cy3 for each array and sub-grid highlighting stray points. ArrayView - Plots the dyes of the array and the severity of the ratio. It also plots intensities. RIPlot - Plots the ratio of dyes on the y-axis and the intensity of the dyes on the x-axis TechRepCheck - Plots all combinations of dyes in a technical replicate across 6 graphs BioRepCheck - Plots all combinations of data in a biological replicate across 6 graphs 4. Data Transformation 5. Model Fitting !Before fitting the data to a model, it must be normalised although MAANOVA does some normalisation during the model fitting as well. !By fitting the data to a model it is possible to tell if variation is due to one or many model parameters. !This removes forms of unwanted variation in the data such as difference between dyes and differences between binding due to sub-grid differences. !Regional LOESS is the chosen algorithm after testing many. !It fits a regression through the data and then uses this regression as an offset to set the mean ratio to zero for the plot. !Intensity remains unchanged. !The fitted model includes Arrays and Dyes (blocking factors) as well as Date, Time and BioRep (treatment factors). !A mixed model would allow proper adjustment for the experimental design but the code needs further adjustment to handle all three random terms. !An average desktop computer takes about 24 hours to fit the model with one random term so three random terms will require a cluster of processors. 6. Selecting Significant Genes 7. Further Work References !After applying a “simple” model, the output can be used to select genes showing greatest variation across samples. !SplineCluster can be used on these significant genes to find genes from similar pathways. R Development Core Team (2007). R: A language and environment for statistical computing. R Foundation for Statistical Computing, Vienna, Austria. ISBN 3-90005107-0, URL http://www.R-project.org. !By taking the variation of the output for all samples for a gene and dividing by the residual mean squared for the gene, a score is produced. !Residual mean squared is an estimate of the mean for that gene across the whole experiment; squared. !These scores can be ranked to find the most significant genes. !Co-regulated genes are most likely to be from the same pathway. !A model can be produced showing the interactions between these genes. !This information can be used to find out the purpose of undocumented genes. !Further experimentation can then confirm these functions. Hao Wu, with ideas from Gary Churchill, Katie Kerr and Xiangqin Cui (2007). MAANOVA: Tools for analyzing Micro Array experiments. R package version 1.4.1. http://www.jax.org/staff/churchill/labsite/software/Rmaanov a/ Kerr M. K., Afshari C. A., Bennett L., Bushel P., Martinez J., Walker N. J., Churchill G. A., Statistical Analysis of a Gene Expression Microarray Experiment with Replication, Statistica Sinica 12(2002), pp. 203-217 Project Supervised by: Poster and Project Work by: Vicky Buchanan-Wollaston, Andrew Mead and Stuart David James McHattie Katherine Denby s.d.j.mchattie@warwick.ac.uk Systems Biology MSc Student


