UVIS Observations of Enceladus’ Plume C. J. Hansen, I. Stewart, L.
advertisement
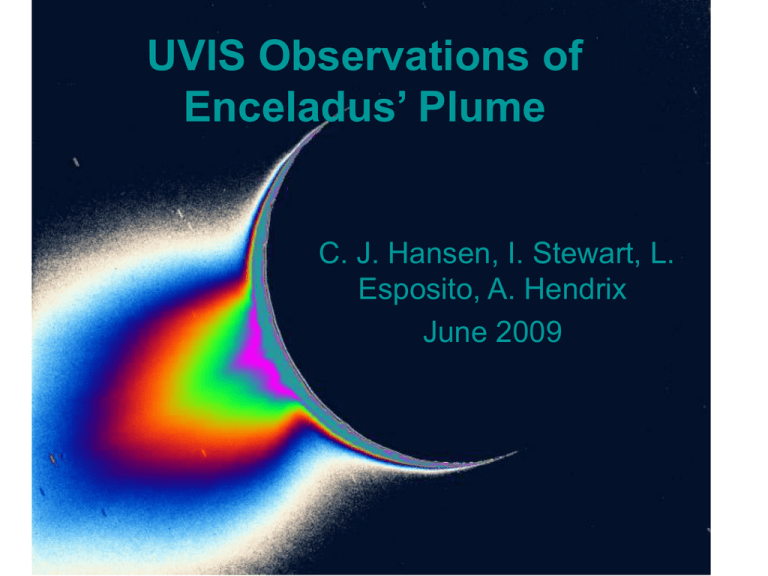
UVIS Observations of Enceladus’ Plume C. J. Hansen, I. Stewart, L. Esposito, A. Hendrix June 2009 Zeta Orionis Occultation 2007 (Alnitak) FUV and HSP data collected FUV: 5 sec integration HSP: 2 msec sampling Horizontal density profile True anomaly = 254 Results documented in Nature, 2008 2005 - gamma Orionis Occultation (Bellatrix) Vertical cut through plume True anomaly = 98 Key results: • • • • Dominant composition = water vapor Plume column density = 1.6 x 10¹⁶ /cm2 Water vapor flux ~ 180 kg/sec Documented in Science, Hansen et al, 2006 Cassini UVIS Characteristics UVIS has 4 separate channels; For star occultations we use the FUV and HSP: • Far UltraViolet (FUV) Spectrograph – 1115 to 1915 Å – 2D detector: 1024 spectral x 64 one-mrad spatial pixels – For occultations we use 512 spectral channels – 5 sec integration time • High Speed Photometer (HSP) – 1115 to 1915 Å – 2 msec time resolution For the solar occultation we will use the EUV spectrograph • Extreme UltraViolet (EUV) • 550 to 1115 Å • 1 sec integration [Not used for stellar occs: • Hydrogen – Deuterium Absorption Cell (HDAC)] 1. Plume Composition and Column Density Terminology: • Plume - large body of gas and particles • Jets individual collimated streams of gas and particles Plume Jets Rev 11 Gamma Orionis Occultation, FUV data UVIS spectra, occulted and unocculted Plot I/I0 to see absorption features • Compare I/I0 to water absorption spectrum • Water vapor: uses Mota cross-sections Best fit column density = 1.6 x 1016 cm-2 • Rev 51 zeta Orionis Occultation: FUV • Absorption is best fit by water vapor • Best fit average column density = 1.5 x 1016 cm-2 • Error bar: +/- 1.4 x 1015 cm-2 • Comparison to 2005 at 15 km altitude • 2007 peak column density = 3.0 x 1016 cm-2 • 2005 = 1.6 x 1016 cm-2 • No detection of CO • formal 2-σ upper limit is 3.6 x 1014 cm-2 • corresponds to mixing ratio with H2O of 3.0 • Our nondetection of CO excludes 3% CO in the plume at the 2 sigma level I/I0 What else can UVIS detect? • Valuable to help resolve ambiguities in INMS detections • INMS detects a species with atomic mass = 28 • Previously thought that this must be CO or N2 – UVIS non-detection rules out CO at the 3% level • New idea (consistent with other INMS data) is that it could be ethylene – C2H4 = 2 * 12 + 4 = 28 Ethylene at 3% H2O Column Density compared to H2O only • Rev 11 gamma Orionis occultation • Ethylene plus water compared to water only • C2H4 column density = 4.8 x 1014 cm-2 • H2O column density = 1.6 x 1016 cm-2 • Water only is still best fit to occulted spectrum although there are some interesting matches to small dips with ethylene added in Methanol Not likely to be detectable, doesn’t look like a good fit anyway… Looking for Nitrogen: Solar Occultation Rev 131 • We have the opportunity to observe an occultation of the sun on Rev 131 • New results are in the EUV, which gives us access to a different wavelength range than the FUV • The big scientific payoff is the chance to definitively detect / measure nitrogen in the plume - important for models of chemistry-driven dynamics in the interior Solar Occultation • This is a simulation of the results we could get from a solar occultation by Enceladus’ plume • UVIS can detect N2 absorption near 972 Ang • Mixing ratio for blue curve, showing clear absorption, is 0.05, close to the INMS derived value of [M28/H2O] = 0.036 • Green curve shows likely detection limit with an order of magnitude less nitrogen, or [M28/H2O] = 0.005 Water Column Density: FUV comparison to HSP 2007 FUV integrations are 5 sec duration FUV spectrum shows gas absorption in Rev 51 time records 89 and 90 Higher time resolution of HSP data shows that the peak column density is about 2x higher than the 5 sec average calculated from the FUV data FUV time record 89 FUV time record 90 2. Looking for jets: Occultation of zeta Orionis October 2007 • In October 2007 zeta Orionis was occulted by Enceladus’ plume • Perfect geometry to get a horizontal cut through the plume and detect density variations indicative of gas jets • Objective was to see if there are gas jets corresponding to dust jets detected in images Gas Jets Density in jets is twice the background plume Gas jet typical width = 10 km at 15 km altitude Ingress a. Cairo (V) b. Alexandria (IV) Feature Feature Number Letter m Occultation Occultation latitude west longitude Likely associated dust jet 1 a 0.032 -79 82 Cairo (V) 2 b 0.000008 -86 112 Alexandria (IV) 3 c 0.00056 -86 192 Baghdad (VI) 6 d 0.026 -84 217 Damascus (II) Egress d. Damascus (II) c. Baghdad (VI) Closest point Groundtrack of Occultation Enhanced HSP absorption features a, b, c, and d can be mapped to dust jets (roman numerals) located by Spitale and Porco (2007) along the tiger stripes • Blue line is groundtrack a b c d Gas Absorption Features, Compared to Dust Jet Locations Plotted here are: • Altitude above Enceladus' limb of the line-of-sight from Cassini to the star • Attenuation of the HSP signal, scaled by a factor of 300 • Projections of the 8 jets seen by the ISS into the plane of the figure • Jets assigned a length of 50 km (for purposes of illustration) • C/A marks the closest approach of the line-of-sight to Enceladus. • The times and positions at which the line-of-sight intersected the centerlines of the jets are marked by squares. The slant of the jets at Baghdad (VII) and Damascus (III) contribute to the overall width of the plume • Gas Jets are idealized as sources along the line of sight with thermal and vertical velocity components • Source strength is varied to match the absorption profile. Gas Jet Model • The ratio of thermal velocity (vt) to vertical velocity (vb) is optimal at vt / vb = 0.65. • Higher thermal velocities would cause the streams to smear together and the HSP would not distinguish the two deepest absorptions as separate events. • The two deepest absorptions indicate jets are collimated, 10 km wide at 15 km altitude Key Result: Vvert / Vthermal = 1.5 Flow is supersonic Groundtrack of Ray 2005 2007 2005 Jets • Jets mapped to increases in opacity • In this occ we do not see B7 (star is occulted by limb before crossing B7) • Is it OK to compare 2005 and 2007? • IF individual jets are only source of plume then no • If gas from entire tiger stripe probably ok Compare 2007 to 2005 - HSP 2005 attenuation <6% at 15 km 2007 attenuation at same altitude ~10% Overall attenuation clearly higher in 2007 compared to 2005 The ratio of the opacity from 16 to 22 km between 2007 and 2005 is 1.4 +/0.4 Comparison to tidal energy model • Hurford et al 2007 model predicts tidallycontrolled differences in eruption activity as a function of where Enceladus is in its eccentric orbit • Substantial changes are not seen in the occultation data, although they would be predicted, based on this model • Expect fissures to open and close Position of Enceladus in its orbit at times of stellar occultations Taken from Hurford et al, Nature 447:292 (2007) True Anomaly (deg) Fraction of orbit from Periapsis Position in Orbit Stress 105 Pa 0 0.0 Periapsis 0.3 90 0.25 One quarter -0.8 97.76 0.27 July 14, 2005 -0.77 180 0.5 Apoapsis -0.4 254.13 0.7 October 24, 2007 0.4 270 0.75 Three quarter 0.6 New Plume Simulations • Ian Stewart is modeling plume water vapor 2007 shown • Model shows that gas needs to come from along tiger stripe, not just jets (based on 2005 results, where we went down to the surface, but saw gas absorption between jets Plume Picture • Opportunity for dual stellar occ by Enceladus’ plume tweaked in, 19 October 2011, epsilon Orionis (blue) and zeta Orionis (white) QuickTime™ and a H.264 decompressor are needed to see this picture. 2011 Occultation Objectives Single stellar occultation – Comparative data 2005 vs. 2007 vs. 2011 • Temporal variability • Activity as f(orbital position) – Better characterization of jets (no compression of HSP data) Dual stellar occultation – Vertical profile of column density • Removes spatial / temporal ambiguity because profiles are acquired at the same time – Overall plume shape – Contribution of jets to plume vs. gas leaking from tiger stripes – Degree of collimation of jets Summary of Results JETS: • HSP data shows 4 features with m < 0.1 (probability of chance occurrence). Typical half-width: 10 km at z = 15 km. • Gas jets can be correlated with dust jets mapped in images on Cairo, Alexandria, Damascus and Baghdad tiger stripes • Jet opacity corresponds to vapor density doubled within jets – Alternate explanation: no excess gas, with all increase due to dust. Then, dust opacity peaks at 0.05 in the jets. This would give 50x more mass in dust compared to vapor within the jet. • Ratio of vertical velocity to thermal velocity in jet = 1.5 – Gas is supersonic • Eight or more jets required to reproduce width and shape of absorption • Jet source is approximately 300 m x 300 m Example Calculations T surface = 140 K V thermal = 359 m/sec V vertical = 552 m/sec For Tsurface = 180 K (from CIRS) V thermal = 406 m/sec V vertical = 624 m/sec Estimation of Water Flux from Enceladus S = flux = N * h2 * v = n/h * h2 * v = n*h*v Where N = number density / cm3 h2 = area v = velocity n = column density measured by UVIS The biggest uncertainty is what to use for h Estimate h from plume dimension, = 80 km Estimate v = 60,000 cm/sec for surface temperature ~ 180K note that escape velocity = 23,000 cm/sec h v S = 1.5 x 1016 * 80 x 105 * 60 x 103 = 0.7 x 1028 H2O molecules / sec = 200 kg / sec Summary of Results PLUME: • H2O column density in 2007 = 1.5 x 1016 cm-2 • Density at 15 km altitude 2x higher – H2O column density in 2007 ~ 3.0 x 1016 cm-2 • Attenuation in HSP data ~10% in 2007, ~6% in 2005 – Difference contradicts Hurford et al model of fissures opening and closing • Plume column density goes as ~ z-2 (z is minimum rayheight) • Water vapor flux ~200 kg/sec • No detection of CO, ethylene not definitive “Search for the Missing Water Source”1 Neutral Species • Water and its products are lost from the system by collisions, photoand electron- dissociation and ionization • Estimates of required re-supply rates, water molecules/sec: • • • • 2.8 x 1027 3.75 x 1027 1028 2 x 1028 1993 2002 2005 2005 Shemansky, et al. 1Jurac, et al. Jurac and Richardson Shemansky, et al. E Ring • Saturn’s E ring, composed primarily of 1 micron particles, is also subject to erosion and loss due to sputtering of water from the surface of the E ring’s dust particles and collisions of particles with Saturn’s moons • Estimate of required re-supply rate: • 1 kg / sec 2002 Juhasz and Horanyi System Oxygen Content - Enceladus’ Influence Backup slides High Speed Photometer (HSP) Data • HSP is sensitive to 1140 to 1900Å • Statistical analysis applied to find features that are probably real – Assumes signal is Poisson distribution – Calculate running mean • Six different bin sizes employed, absorptions compared, persistence of feature is part of test • m is the number of such events one would expect to occur by chance in the data set • m<<1 are likely to be real events Possible real features: 1 (a) m = 0.032 2 (b) m = 0.000008 3 (c) m = 0.00056 6 (d) m = 0.026 FUV analysis Occ is easy to detect Star drifted from pixel 13 to pixel 12 over the course of the observation Summary 2007 Occultation of Zeta Orionis - new results • • • • • • • • Overall plume shape and density Significant events are likely gas jets UVIS gas jets correlate with dust jets in images Previous Monte Carlo model updated with new data We characterize jet widths, opacity, density Ratio of thermal velocity to vertical velocity = 0.65, supersonic Water vapor abundance derived from new FUV spectra, no CO Comparison of 2005 to 2007 occultations does not substantiate tidally-controlled energy-source models Paper published in Nature 11-27-08 Solar Occultation How well can UVIS measure N2 with a solar occultation? • Abundance of H2O measured by UVIS = 1.5 x 1016 cm-2 • Mixing ratio of mass 28 in the INMS experiment at Enceladus was [M28]/[H2O]=0.036 • A solar occultation has been simulated for our H2O optical depth assuming a commingled mixture of H2O and N2 in the spectral region of the H Ly line • The ability to measure N2 in a mixing ratio of [N2]/[H2O] = 0.005 is indicated, for an abundance of N2 = 1 x 1014 cm-2 How do we know? • N2 was measured above the exobase in the UVIS T10 solar occultation observation using the measured extinction of the sol H Ly line by the N2 b(3,0) band.
