Document 12625141
advertisement
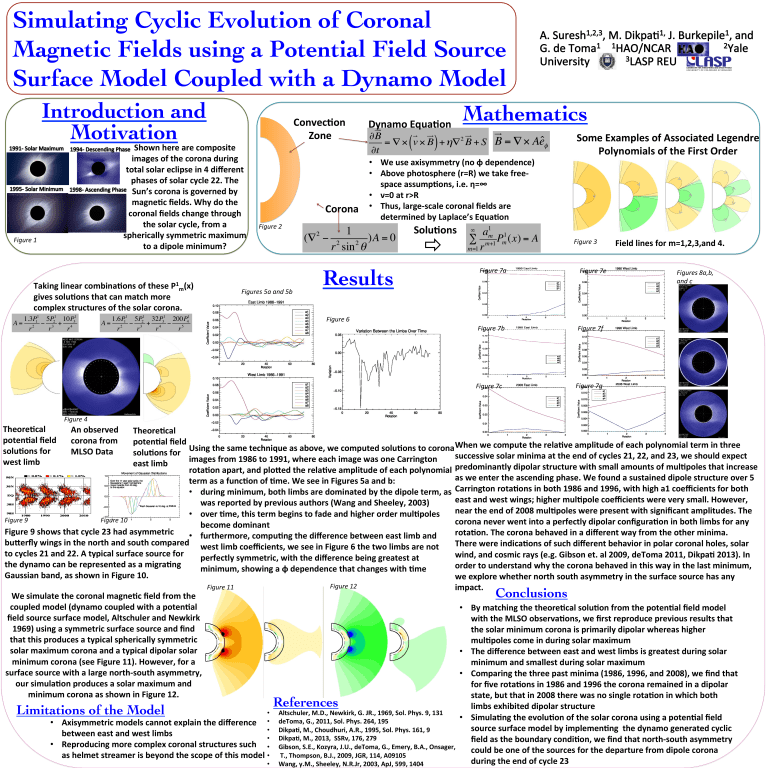
Simulating Cyclic Evolution of Coronal Magnetic Fields using a Potential Field Source Surface Model Coupled with a Dynamo Model gives solu>ons that can match more complex structures of the solar corona. 1 1 1 2 3 1 3 1.3P 5P 10P A= 2 − + 4 r r r Theore>cal poten>al field solu>ons for west limb 1 1 1 2 3 1 3 1 4 1.6P 5P 32P 200P A= 2 − + 4 − r r r r5 Figure 4 An observed ) • We use axisymmetry (no φ dependence) • Above photosphere (r=R) we take free-­‐ space assump>ons, i.e. η=∞ • ν=0 at r>R • Thus, large-­‐scale coronal fields are determined by Laplace’s Equa>on 1 (∇ − 2 2 )A = 0 r sin θ 2 Results Solu>ons 1 1 m m+1 m a P (x) = A ∑ m=1 r ∞ > Taking linear combina>ons of these P1m(x) Figure 2 ( Some Examples of Associated Legendre Polynomials of the First Order > Figure 1 Corona ∂B 2 = ∇ × v × B + η∇ B + S B = ∇ × Aêφ ∂t ñ Shown here are composite images of the corona during total solar eclipse in 4 different phases of solar cycle 22. The Sun’s corona is governed by magne>c fields. Why do the coronal fields change through the solar cycle, from a spherically symmetric maximum to a dipole minimum? Dynamo Equa>on > Convec>on Zone Mathematics Figure 3 Figure 7a Figure 7e Figure 7b Figure 7f Figure 7c Figure 7g Figures 5a and 5b > Introduction and Motivation Field lines for m=1,2,3,and 4. Figures 8a,b, and c Figure 6 Theore>cal corona from poten>al field When we compute the rela>ve amplitude of each polynomial term in three Using t he s ame t echnique a s a bove, w e c omputed s olu>ons t o c orona MLSO Data solu>ons for successive solar minima at the end of cycles 21, 22, and 23, we should expect images f rom 1 986 t o 1 991, w here e ach i mage w as o ne C arrington east limb rota>on apart, and plo_ed the rela>ve amplitude of each polynomial predominantly dipolar structure with small amounts of mul>poles that increase as we enter the ascending phase. We found a sustained dipole structure over 5 term as a func>on of >me. We see in Figures 5a and b: • during minimum, both limbs are dominated by the dipole term, as Carrington rota>ons in both 1986 and 1996, with high a1 coefficients for both east and west wings; higher mul>pole coefficients were very small. However, was reported by previous authors (Wang and Sheeley, 2003) • over >me, this term begins to fade and higher order mul>poles near the end of 2008 mul>poles were present with significant amplitudes. The Figure 9 Figure 10 corona never went into a perfectly dipolar configura>on in both limbs for any become dominant Figure 9 shows that cycle 23 had asymmetric • furthermore, compu>ng the difference between east limb and rota>on. The corona behaved in a different way from the other minima. bu_erfly wings in the north and south compared west limb coefficients, we see in Figure 6 the two limbs are not There were indica>ons of such different behavior in polar coronal holes, solar to cycles 21 and 22. A typical surface source for wind, and cosmic rays (e.g. Gibson et. al 2009, deToma 2011, Dikpa> 2013). In perfectly symmetric, with the difference being greatest at the dynamo can be represented as a migra>ng order to understand why the corona behaved in this way in the last minimum, minimum, showing a φ dependence that changes with >me Gaussian band, as shown in Figure 10. we explore whether north south asymmetry in the surface source has any Figure 12 Figure 11 impact. Conclusions We simulate the coronal magne>c field from the coupled model (dynamo coupled with a poten>al • By matching the theore>cal solu>on from the poten>al field model field source surface model, Altschuler and Newkirk with the MLSO observa>ons, we first reproduce previous results that 1969) using a symmetric surface source and find the solar minimum corona is primarily dipolar whereas higher that this produces a typical spherically symmetric mul>poles come in during solar maximum solar maximum corona and a typical dipolar solar • The difference between east and west limbs is greatest during solar minimum corona (see Figure 11). However, for a minimum and smallest during solar maximum surface source with a large north-­‐south asymmetry, • Comparing the three past minima (1986, 1996, and 2008), we find that our simula>on produces a solar maximum and for five rota>ons in 1986 and 1996 the corona remained in a dipolar minimum corona as shown in Figure 12. state, but that in 2008 there was no single rota>on in which both References limbs exhibited dipolar structure Limitations of the Model • Altschuler, M.D., Newkirk, G. JR., 1969, Sol. Phys. 9, 131 • Simula>ng t he e volu>on o f t he s olar c orona u sing a p oten>al fi eld • Axisymmetric models cannot explain the difference • deToma, G., 2011, Sol. Phys. 264, 195 source surface model by implemen>ng the dynamo generated cyclic • Dikpa>, M., Choudhuri, A.R., 1995, Sol. Phys. 161, 9 between east and west limbs • Dikpa>, M., 2013, SSRv, 176, 279 field as the boundary condi>on, we find that north-­‐south asymmetry • Reproducing more complex coronal structures such • Gibson, S.E., Kozyra, J.U., deToma, G., Emery, B.A., Onsager, could be one of the sources for the departure from dipole corona as helmet streamer is beyond the scope of this model • T., Thompson, B.J., 2009, JGR, 114, A09105 during the end of cycle 23 • Wang, y.M., Sheeley, N.R.Jr, 2003, ApJ, 599, 1404
![30 — The Sun [Revision : 1.1]](http://s3.studylib.net/store/data/008424494_1-d5dfc28926e982e7bb73a0c64665bcf7-300x300.png)
