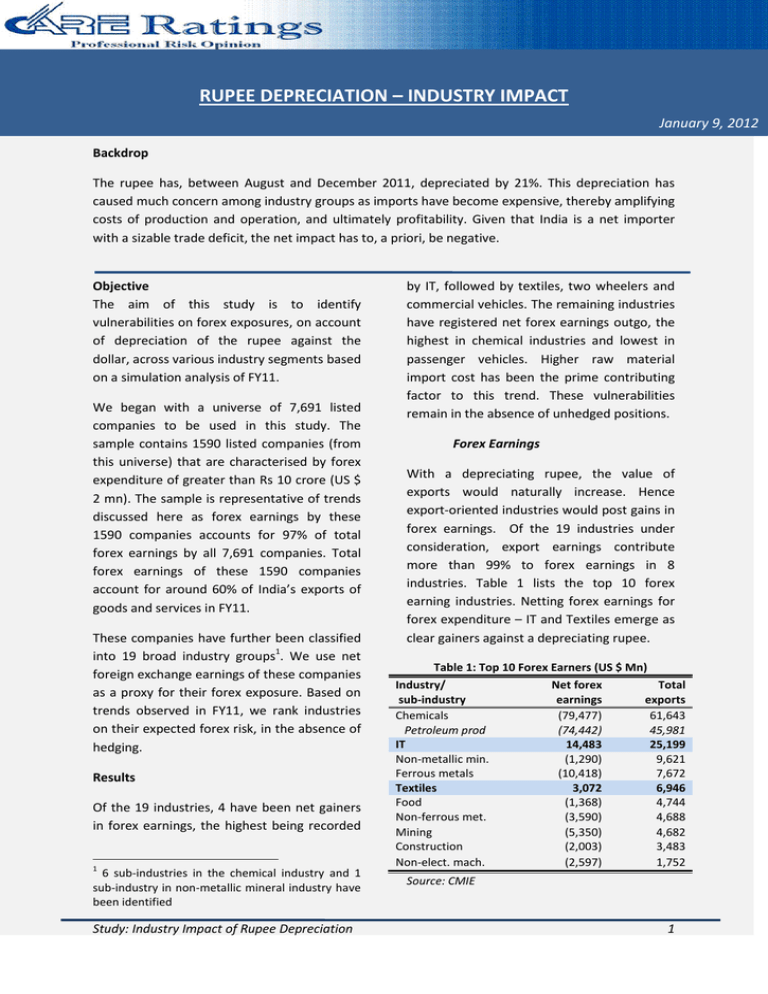
The rupee has, between August ... Backdrop
advertisement

RUPEE DEPRECIATION – INDUSTRY IMPACT January 9, 2012 Backdrop The rupee has, between August and December 2011, depreciated by 21%. This depreciation has caused much concern among industry groups as imports have become expensive, thereby amplifying costs of production and operation, and ultimately profitability. Given that India is a net importer with a sizable trade deficit, the net impact has to, a priori, be negative. Objective The aim of this study is to identify vulnerabilities on forex exposures, on account of depreciation of the rupee against the dollar, across various industry segments based on a simulation analysis of FY11. We began with a universe of 7,691 listed companies to be used in this study. The sample contains 1590 listed companies (from this universe) that are characterised by forex expenditure of greater than Rs 10 crore (US $ 2 mn). The sample is representative of trends discussed here as forex earnings by these 1590 companies accounts for 97% of total forex earnings by all 7,691 companies. Total forex earnings of these 1590 companies account for around 60% of India’s exports of goods and services in FY11. These companies have further been classified into 19 broad industry groups1. We use net foreign exchange earnings of these companies as a proxy for their forex exposure. Based on trends observed in FY11, we rank industries on their expected forex risk, in the absence of hedging. Results Of the 19 industries, 4 have been net gainers in forex earnings, the highest being recorded 1 6 sub-industries in the chemical industry and 1 sub-industry in non-metallic mineral industry have been identified Study: Industry Impact of Rupee Depreciation by IT, followed by textiles, two wheelers and commercial vehicles. The remaining industries have registered net forex earnings outgo, the highest in chemical industries and lowest in passenger vehicles. Higher raw material import cost has been the prime contributing factor to this trend. These vulnerabilities remain in the absence of unhedged positions. Forex Earnings With a depreciating rupee, the value of exports would naturally increase. Hence export-oriented industries would post gains in forex earnings. Of the 19 industries under consideration, export earnings contribute more than 99% to forex earnings in 8 industries. Table 1 lists the top 10 forex earning industries. Netting forex earnings for forex expenditure – IT and Textiles emerge as clear gainers against a depreciating rupee. Table 1: Top 10 Forex Earners (US $ Mn) Industry/ sub-industry Chemicals Petroleum prod IT Non-metallic min. Ferrous metals Textiles Food Non-ferrous met. Mining Construction Non-elect. mach. Net forex earnings (79,477) (74,442) 14,483 (1,290) (10,418) 3,072 (1,368) (3,590) (5,350) (2,003) (2,597) Total exports 61,643 45,981 25,199 9,621 7,672 6,946 4,744 4,688 4,682 3,483 1,752 Source: CMIE 1 Table 2: 10 Largest Spenders in Forex (US $ Mn) Forex Expenditure Table 2 lists 10 industries that have the highest forex expenditure. These industries would be affected by higher input costs on account of a depreciating rupee. IT is evidently an outlier here – though forex expenditure is substantial they are offset by higher forex earnings, yielding an overall positive net forex earnings position. Industry /Segment Chemicals Petroleum prod Ferrous metals Non-metallic min. IT Mining Non-ferrous met. Food Power Construction Non-elect. mach. Net forex earnings (79,477) (74,442) (10,418) (1,290) 14,483 (5,350) (3,590) (1,368) (5,583) (2,003) (2,597) Forex Expenditure 1,41,120 1,20,361 18,090 10,911 10,717 10,032 8,277 6,112 5,759 5,486 4,349 Source: CMIE Table 3: Profile of Forex Expenditure (Share in total) Industry /Segment All Non ferrous metals Ferrous metals Non-electrical machinery Construction IT Textiles Electrical machinery Electronics Chemicals Raw mat 66.4 90.9 88.1 85.2 70.6 67.8 66.1 65.5 64.8 62.3 Finished goods 9.9 4.9 6.1 1.2 2.3 3.8 13.4 10.3 13.1 21.7 Capital goods 7.4 0.6 1.2 7.1 14.0 7.6 7.3 9.0 3.2 3.0 Stores 2.6 0.5 0.6 3.0 6.3 1.2 2.7 4.3 1.1 0.7 Interest 0.9 0.3 0.4 0.9 2.0 1.2 0.4 1.2 0.3 1.1 Source: CMIE Table 3 provides a profile of forex expenditure. Forex expenditure across industries is concentrated in raw material costs (2/3 of total) and expenditure on finished goods, capital goods, inventories, interest and dividend. Metals and non-electrical machinery industries are by far most affected by raw material forex expenditure, the same contributing more than 85% to total forex expenditure in these industries. Study: Industry Impact of Rupee Depreciation Financials of gems and jewellery and some chemical based industries such as petroleum, fertilizers and pharmaceuticals would also be impacted by higher raw material expenditure. As we move to other industry segments, the heads of forex expenditure get more diversified. Industries such as IT, Telecom services, auto ancillaries, mining and commercial vehicles have significant contribution under expense heads of technology royalties, remittances and travel. 2 Industry Impact Based on the profile of forex income and expenditure flows, below are identified some industries and industry segments that are most likely to be affected adversely by a depreciation in the rupee. It may be noted that these inferences are drawn under ceteris paribus assumptions based on performance in FY11 and in the absence of hedging. Trends this year seem to replicate FY09 trends when the rupee deprecated more than 15% and global economic conditions were bleak. were to contract, currency gains would dominate. IT – the sharp depreciation in rupee is expected to boost software sales and forex gains in coming months o Table 4: Gainers and Losers Industry Gainers - - Losers IT - Chemicals Textiles - Ferrous metals Two wheelers - Power Commercial - Mining vehicles - Non ferrous metals - Non-electrical machinery - Construction - Electronics - Telecom services - Food Industry Segment Gainers Losers Pharmaceuticals - Petroleum Products Gems and - Fertilizers jewellery - Polymers - Tyres and tubes - Cosmetics Risk factors For the Gainers - With bleak macro-economic outlook governing producer sentiments and consumption demand; exporters of IT services, textiles, pharmaceuticals and gems and jewellery could witness a reduction in global demand for goods and services. However, even if buoyancy in export volumes Study: Industry Impact of Rupee Depreciation Remittances, travel expenses and dividends could increase outflows, however, they are unlikely to cause an abrasion in the P&L position of these companies Textiles – with easing of cotton and cotton yarn prices and improved export realisations, the textile industry is expected to gain in the current forex environment. Mark-to-market losses on existing hedged positions and suitability of new hedging contracts would be crucial determinants of overall profitability o The man-made fibres segment could face some pressure on account of higher import costs of inputs and marked-to-market losses on expenses. Dollardenominated expenses could lend some offsetting support to margins Pharmaceuticals – companies in this industry are net exporters and stand to gains through higher export realisations enhanced by a depreciating rupee o Losses on external commercial borrowings (ECBs) and limited feasibility of conversion on foreign currency convertible bonds (FCCBs) pose a concern to these companies, but are not expected to be huge Gems and jewellery – with increased investment demand amidst a volatile global economy, prices of gold and other metals, which are inputs to this industry, have witnessed steep rise. Consequently 3 the sectors profitability could be affected. However, the sector is export-oriented and is expected to gain against the rupee depreciation trend For the Losers - Downside risks for losers could magnify with rapid depreciation of the rupee. Industries such as chemicals especially petroleum and fertilizers, ferrous metals, power, are metals/minerals-based industries. Lower production levels in metals and minerals manifested in increased prices of these commodities in 2011. Global prices of metals and minerals have moderated recently; however supply shocks causing spike in input costs coupled with rupee depreciation could magnify the adverse impact on the bottom-lines of these industries. Ferrous metals – steep rise in prices of coking coal and iron ore aggravated by adverse rupee movements is expected to continue to pressure raw material costs for this industry and allied segments. o Rather muted industrial production and investment activity in this industry on account of a tighter monetary regime could further manifest in contraction of supply Power – thermal power plants are expected to face some strain on account of higher import costs of ferrous metals and petroleum products, which in turn are expected to remain firm in the near future. Furthermore, some OMCs have restated assets in rupee terms and are likely to face added pressure in coming months Fertilizers – the industry imports about 50% of its raw material requirement. In Q3 FY12, raw material expenses rose sharply by nearly 20% on account of higher input costs against elevated global prices and depreciation in rupee o Potassium chloride is one of the major import items and a decline is already being observed in the same. This trend is likely to continue in the coming months along with a decline in sales Conclusion We expect the rupee to settle in the range of Rs 52-54 to a dollar by the end of this fiscal. This could, ceteris paribus, turn out a positive for export-oriented industries such as IT, textiles, pharmaceuticals and gems and jewellery. On the other hand, industries based on metals, minerals and chemicals are expected to be under some pressure and the extent of hedging will determine final net loss on account of rupee depreciation. While these inferences are based on performance recorded in FY11, the final outcome is expected to follow the trend barring aberrations on account of hedged positions. --------------------------------------------- -------------------------------------------------------------------------------- Analyzed by: Contact: Krithika Subramanian, Madan Sabnavis, Associate Economist Chief Economist krithika.subramanian@careratings.com madan.sabnavis@careratings.com 91-022-675343521 91-022-67543489 Petroleum products – Delays in -------------------------------------------------------------------------------------------------------------------------------disbursements of cash subsidies by the Disclaimer government to OMCs against a likely fiscal The Report is prepared by the Economics Division of CARE Limited. The Report is meant for providing an analytical view on the subject and is not a recommendation made by CARE. The information is obtained from sources considered to be reliable and CARE does not guarantee the accuracy of such information and is not responsible for any decision taken based on this Report. Study: Industry Impact of Rupee Depreciation 4


