Document 12431517
advertisement
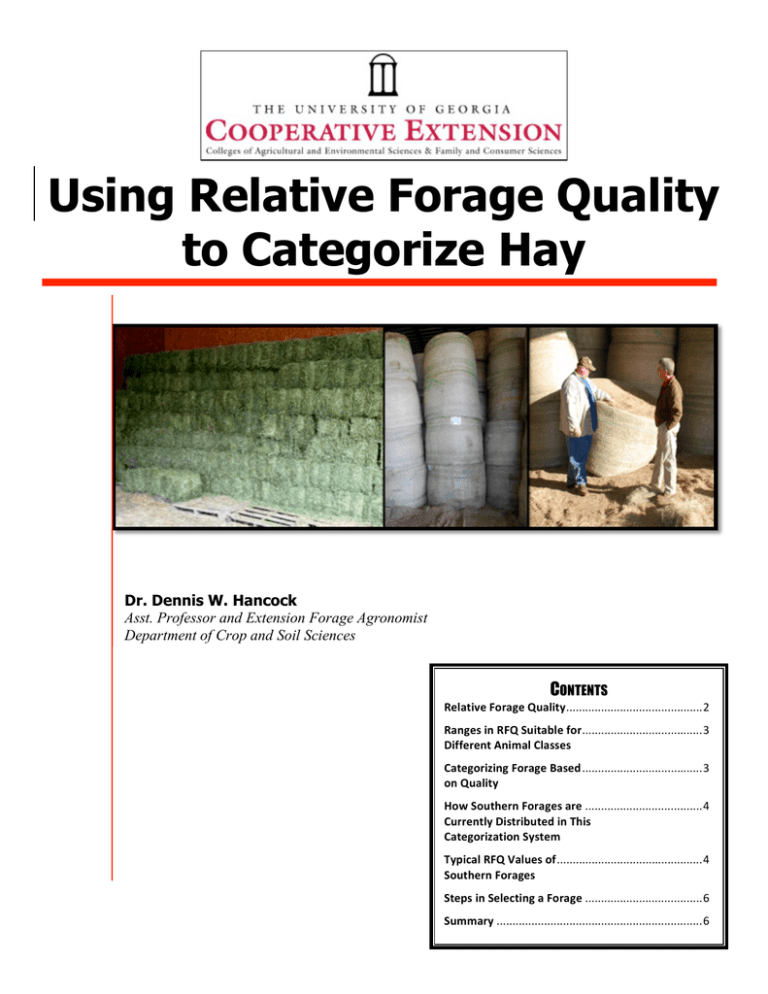
Using Relative Forage Quality to Categorize Hay Dr. Dennis W. Hancock Asst. Professor and Extension Forage Agronomist Department of Crop and Soil Sciences CONTENTS Relative Forage Quality ........................................... 2 Ranges in RFQ Suitable for ...................................... 3 Different Animal Classes Categorizing Forage Based ...................................... 3 on Quality How Southern Forages are ..................................... 4 Currently Distributed in This Categorization System Typical RFQ Values of .............................................. 4 Southern Forages Steps in Selecting a Forage ..................................... 6 Summary ................................................................. 6 Using Relative Forage Quality to Categorize Hay Forage quality includes various visual and chemical factors that make forage valuable. In select cases, forage quality may be defined on the basis of aesthetics (e.g., green color, smell, physical characteristics, etc.). However, these aesthetic characteristics reflect the conditions in which the hay was produced and reveal little or nothing about the actual nutritional value of the forage. Whether it is the production of meat, milk, fiber, or work or merely the maintenance of body weight and condition, animal performance is driven by the amount of calories the animal digests and utilizes. Though protein, minerals, vitamins, and water must also meet or exceed the requirements for the desired level of performance, the most limiting factor is typically the amount of digestible energy that the animal consumes. As a result, high-quality forage is one that contains large concentrations of digestible nutrients and is capable of being consumed in large amounts. Scientists have developed several different of measures of forage quality. Unfortunately, the majority of those forage quality metrics do not easily allow for a comparison of different forage types or species. To understand this, consider the following example: A 10-ton load of annual ryegrass hay may have the same total caloric content as the same amount of bermudagrass hay. However, the annual ryegrass is likely to be more highly digestible, and the animals are likely to consume more of it than the bermudagrass. Consequently, the load of annual ryegrass is more valuable than the bermudagrass in this case. Relative Forage Quality To simplify assessments of forage quality, Drs. John E. Moore (University of Florida) and Dan Undersander (University of Wisconsin) developed the Relative Forage Quality (RFQ) calculation. There are two factors used in the RFQ measurement (Equation 1). These include: 1) Total Digestible Nutrients (TDN), which is a measure of digestible energy and 2) a calculated estimate of dry matter intake (DMI). Equation 1: RFQ = TDN x DMI 1.23 Nutritionists have found TDN to be a reliable basis for ensuring that the rations and diets that they develop meet the animals’ need for digestible energy. Similarly, animal scientists have conducted numerous feeding studies and continue to refine equations that estimate DMI for many forage species. Individually, the factors of TDN and DMI can fairly represent elements of forage quality for a particular forage species and type. However, when combined, these two factors provide a robust measure of forage quality. For a more in-depth definition of RFQ and the determination of TDN and DMI, see Extension publication B1367 entitled “Common Terms Used in Animal Feeding and Nutrition” (http://www.caes.uga.edu/Publications/displayHTML.cfm?pk_id=7876). Additionally, there is an adjustment used in the RFQ calculation, which provides the RFQ term with a reference point to market value. The RFQ equation was designed to have a reference point of 100, which is roughly the equivalent to fully mature alfalfa (this is the purpose for the unitless denominator value, 1.23). Since the base price for hay sales and auctions in many parts of the world is the value of poor-quality alfalfa, RFQ provides a mechanism for indexing quality to value. 2 Ranges in RFQ suitable for Different Animal Classes As a result of the robustness of the RFQ measure, scientists have been able to link ranges of RFQ that are most likely to meet the needs of different animal classes. These ranges can be found in Figure 1. This would allow the livestock manager who has RFQ data on a particular lot of forage to quickly determine if it is appropriate to the needs of the animal class that he or she is managing. These ranges illustrate the RFQ values that are most likely to minimize supplementation. Just because a forage lot falls within these recommended ranges DOES NOT mean that it will automatically provide all the nutrients needed for the livestock being fed. One does not use RFQ to develop a ration. However, RFQ provides a reasonable first approximation as to whether or not a forage will provide a cost-effective base to the diet being fed to the selected animal class. Figure 1. The Relative Forage Quality (RFQ) range that are suitable to various livestock classes. Adapted from Undersander et al., 2011. An RFQ value that is lower than the identified range could still work for the animal class that is being fed. However, additional supplementation will likely be required. This additional supplementation may make the ration (forage + supplement) less economical. Categorizing Forage Based on Quality In addition to determining if a forage lot is likely to be cost-effective for different animal classes, RFQ can also be used to categorize hay into quality grades. The Southeastern Forage Quality categorization system is outlined in Table 1. This system allows for the categorization of forages into grades that could be used for marketing purposes, similar to grading systems used in other agricultural industries (e.g., USDA meat inspection grades or USDA feeder cattle grades). Table 1. The categories and RFQ ranges used in the Southeastern Forage Quality categorization system. Forage Quality Category Premium Good Fair Utility RFQ > 140 110-139 90-109 < 90 The Southeastern Forage Quality categorization system is relatively independent of species or type. Since RFQ values of different forage species and types can be compared on an “apples to apples” basis, the Southeastern Forage Quality categorization is a fair and robust system. This categorization system also allows for a range of appropriate prices within a category. As RFQ is not directly used in ration development, the final valuation of the forage lot can be decided upon by the forage’s cost or value in the ration. 3 By comparing the Southeastern Forage Quality categorization system with the RFQ ranges suitable for different animal classes, one can see that the categories match well with several major livestock enterprises. Beef cattle and horse producers will primarily find the “Fair” category to be most suitable to dry (non-lactating) stock and horses that are not doing substantial work. When nutritional needs exceed maintenance, those producers should choose hay from the “Good” category and place an emphasis on higher RFQ scores within that range for those livestock classes that are expected to rapidly gain weight or do hard work. In contrast, dairy producers will need to select forage from the “Good” and “Premium” categories, with the “Premium” quality reserved for high-producing dairy cows and young calves. Finally, this categorization system clearly identifies forage (i.e., the Utility category) that is most unlikely to be nutritionally sufficient or result in a cost-effective ration. How Southern Forages are Currently Distributed in this Categorization System Table 2 can help one to better understand how southern forages would generally fare in the RFQbased Southeastern Forage Quality categorization system. Of the more than 16,000 forage samples submitted into the University of Georgia’s Feed and Environmental Water Laboratory during the growing seasons between 2004 and 2010, nearly 40% fell into the Utility category on average. In contrast, an average of only about 7% of the samples were in the Premium category. However, there is substantial variation from year to year. Table 2. The frequency (expressed as a percent of all samples from a growing season) with which samples fell into the Premium (RFQ > 140), Good (110-139), Fair (90-109), and Utility (< 90) categories. Samples included all those submitted to the University of Georgia’s Feed and Environmental Water Laboratory for forage analysis from the growing seasons between 2004 and 2010. The pie chart summarizes these data with the 7-year average frequency for the categories. Year Premium Good Fair Utility ------------------------- RFQ ------------------------> 140 110-139 90-109 < 90 2004 2.3% 14.8% 25.1% 57.7% 2005 5.7% 19.6% 33.1% 41.7% 2006 11.1% 27.3% 31.9% 29.6% 2007 11.2% 26.8% 35.6% 26.4% 2008 9.2% 21.9% 37.9% 31.0% 2009 6.7% 21.6% 42.4% 29.3% 2010 3.2% 8.9% 30.4% 57.5% Typical RFQ Values of Southern Forages It is a good idea to frequently assess the effect that management has on the quality of the forage that they produce. The first step is to determine how the forage that is produced compares to that of other samples of the same species or type. Figure 2 provides a summary that was performed on the more than 16,000 forage samples sent into the University of Georgia’s Feed and Environmental Water Laboratory during the growing seasons between 2004 and 2010. Another way to assess the effect that one’s management is having on the forage quality is to compare their results to the results of similar forage species submitted to hay and regional or national forage contests. One such contest, the Southeastern Hay Contest, is run in conjunction with the annual Sunbelt Agricultural Exposition in Moultrie, GA. 4 Figure 2. The summary statistics for the Relative Forage Quality (RFQ) of some of the most common forage species/types in the South. Data from more than 16,000 forage samples sent into the University of Georgia’s Feed and Environmental Water Laboratory during the growing seasons between 2004 and 2010 were summarized. The range shown as the horizontal yellow/green bars represents values that are one standard deviation about the average (vertical black line), meaning that approximately two-thirds of the samples fell into this range. The lines that extend beyond this range illustrate the extent of two standard deviations away from the average, which encompassed 95% of the samples submitted. Since 2004, producers from 10 southeastern states have submitted entries to this contest. This contest is judged solely on the basis of RFQ (samples that are too high in moisture or nitrate concentration are eliminated). In 2007, the contest was divided into six different forage categories. Table 3 presents the winning RFQ values for the entries to the contest in each of these categories from 2007-2010. Table 3. The Relative Forage Quality (RFQ) of winning entries in the six Southeastern Hay Contest categories from 2007-10. Contest Category 2007 2008 2009 (RFQ) 2010 149 144 155 124 157 163 154 125 Mixed & Annual Grass 211 178 175 209 Grass Baleage 225 164 166 192 Legume Baleage 256 144 163 112 Alfalfa/Perennial Peanut 237 225 264 204 Warm Season Perennial Grass Cool Season Perennial Grass 5 Steps in Selecting a Forage Selecting the best lot of hay, silage, or other forage for one’s livestock class includes several steps. A general procedure for selecting the right forage is provided below. 1. Identify the class of livestock that is to be fed (e.g., dry cow, hard-working horse, dairy cow in the first 120 days of lactation, etc.). 2. Using Figure 1, determine the RFQ range for that livestock class and determine if it generally falls in the “Premium,” “Good,” or “Fair” category. 3. Identify forage lots that fall into the desired category and RFQ range. 4. Use the estimates of specific nutritional metrics (i.e., TDN, CP, Ca, P, etc.) to develop a balanced ration and calculate the cost of the ration including the forage lot in question. - It is recommended that producers avoid the purchase of forage lots that have not been tested for nutritional content. - Forage that has a RFQ score will also have been evaluated for other nutritional measures. Insist on having access to those values. - If formulating a ration for beef cattle, a free balancing program entitled “UGA Basic Balancer” is available here: http://www.caes.uga.edu/Publications/pubDetail.cfm?pk_id=7887). 5. Compare the available forage lots based on the cost of the ration (NOT just the cost of the forage) and select the forage lot that allows for the least-cost ration. Note that the RFQ index is only used in the preliminary steps. Once a producer has identified one or more forage lots that appear (based on RFQ) to be capable of meeting the nutritional requirements of the livestock, they will need to determine if the cost of that lot(s) will result in a balanced ration at the lowest cost. Summary The calculation of Relative Forage Quality (RFQ) can provide a useful index for defining which forage lots are most likely to meet nutritional needs of the livestock being fed. Because RFQ is based on estimates of digestible energy (TDN) and dry matter intake (DMI), it is a robust metric that allows an “apples-to-apples” comparison of different forage lots, including lots from differing forage species. Since RFQ provides a method of approximating which forage lots are most likely to meet nutritional goals, it is a useful tool for categorization. Using RFQ to categorize hay on nutritive value can help to differentiate those lots that are more or less valuable, thus it can be a useful marketing and decision-making tool. RFQ is not used in ration balancing and, as such, using it to directly set the price of a forage lot would be inappropriate. However, identifying RFQ ranges and categorizes that are appropriate for the livestock being fed can help the producer in the initial steps of selecting a forage lot that will result in a least-cost ration. 6 For More Information on this or other Forage-­‐Related Topics Visit our Website: www.georgiaforages.com The University of Georgia and Ft. Valley State University, the U.S. Department of Agriculture and counties of the state cooperating. Cooperative Extension, the University of Georgia College of Agricultural and Environmental Sciences, offers educational programs, assistance and materials to all people without regard to race, color, national origin, age, gender or disability. An Equal Opportunity Employer/Affirmative Action Organization Committed to a Diverse Work Force CSS-­‐F048 August 2011 7 July 2011 Issued in furtherance of Cooperative Extension work, Acts of May 8 and June 30, 1914, The University of Georgia College of Agricultural and Environmental Sciences and the U.S. Department of Agriculture cooperating. J. Scott Angle, Dean and Director. 8
