An Update on McIDAS-V Planning and Development Tom Achtor McIDAS Users’ Group Meeting
advertisement
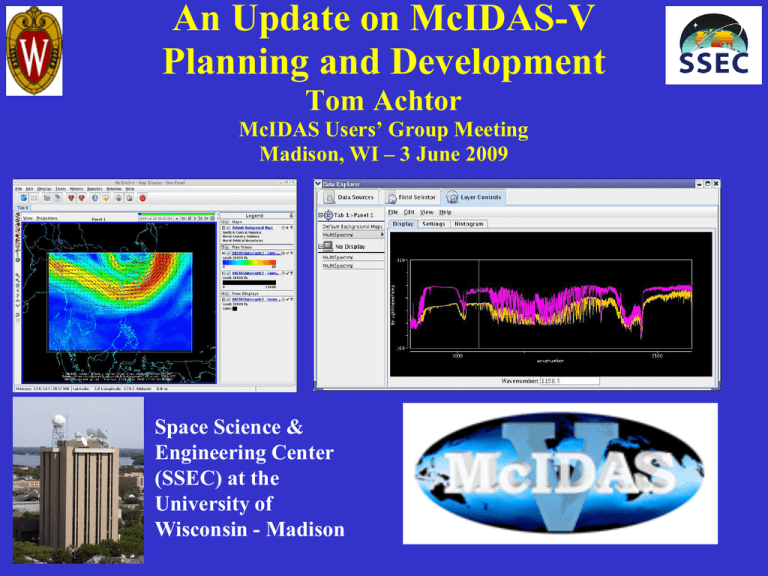
An Update on McIDAS-V Planning and Development Tom Achtor McIDAS Users’ Group Meeting Madison, WI – 3 June 2009 Space Science & Engineering Center (SSEC) at the University of Wisconsin - Madison Outline A brief history • McIDAS-V goals and requirements • Moving towards beta and beyond • Supporting development in a soft money research center Looking forward • Addressing key development issues • Continuing to find support • Expanding the user base McIDAS-V Project Requirements • Create a powerful and versatile software system for environmental data processing, analysis and visualization • Continue to fully support McIDAS Users’ Group (MUG) and McIDAS-X functionality as users transition to McIDAS-V • Support existing and evolving needs of scientific research and algorithm/applications development for new programs • Support operational users by providing frameworks in McIDAS-V, enabling a natural transition path for research results into operations • Support data fusion and algorithm interoperability from existing and future sources • Use system to educate students in remote sensing and physical sciences; involve students in its development, evolution and use McIDAS-V 6 initial goals to beta • • • • • • Easy installation and configuration New McIDAS-V User Interface to better support satellite data analysis and visualization McIDAS-V must be able to “bridge” with current McIDAS-X Integrate HYDRA (Hyperspectral Viewer for Development of Research Applications) into McIDAS-V High quality documentation with ample training materials Make system (relatively) bug-free McIDAS-V reaches ‘beta’ Visit SSEC booth 435 to see a demo or talk to a developer Outline A brief history • McIDAS-V goals and requirements • Moving towards beta and beyond • Supporting development in a soft money research center Looking forward • Addressing key development issues • Continuing to find support • Expanding the user base McIDAS-V Support (1) • VisAD developer Bill Hibbard provides guidance • Unidata, through development of the IDV and continuous communication is a strong collaborator • SSEC provides in house support for tasks without support • MUG is providing support for the Bridge, the UI and numerous other low level improvements (e.g. performance) and for forums, training, etc – Active participation by the MAC is very important to support MUG needs and goals McIDAS-V Support (2) • The GOES-R program (Risk Reduction and AWG) is supporting the continued development of HYDRA, the inclusion of additional data types, the evaluation of operational algorithms, etc. • The IPO (NPP/NPOESS) is providing new support for multi and hyperspectral data acquisition and analysis (e.g. AIRS, IASI) • Individual science projects are supporting advancement by using McIDAS-V in their applications and providing feedback • These projects support about 7 FTE HYDRA Interrogation of multi- and hyper-spectral data Developer: Tom Rink SSEC – Display individual pixel location and spectral band measurements – Combine spectral channels in linear functions and display resulting image products – Construct false color images from multiple channel combinations – Create scatter plots of spectral channel combinations – Locate image pixels in scatter plots and vice versa – Display transects of measurements – Compare Level 2 products (e.g. soundings of temperature and moisture as well as spectra from selected pixels) – Integrated data and product analysis/evaluation between Geostationary and Polar observing platforms Scatter plot of MODIS VIS–IR observations (user identifies highlighted regions) MODIS define a transect to display radiance measurements •Convection case study: 19 June 2007 •AIRS granule - user selects locations for spectra •Slider bar selects •spectral band • for display •AIRS zooming in on spectra to display online – offline calculations: 19 June 2007 Accessing Data in McIDAS-V • Remote data servers – OpenADDE (Abstract Data Distribution Environment) – OPeNDAP (Open-source Project for a Network Data Access Protocol) – THREDDS (Thematic Realtime Environmental Distributed Data Services) – HTTP • Local data – ADDE servers – VisAD file adapters •ABI bands from NWP simulation (CIMSS AWG Proxy Team) •NOAA/NESDIS STAR •Current Imager bands of Hurricane Katrina •1.61 m •0.64 m •2.26 m •0.86 m •3.9 m •6.95 m •7.34 m •8.5 m •10.35 m •11.2 m •12.3 m •1.38 m •6.19 m •9.61 m •13.3 m •NOAA/NESDIS STAR and GOES-R Imagery Team •AWG Proxy ABI Simulations of Hurricane Katrina •0.47 m McIDAS-V Conference Presentations • AMS IIPS - 2005, 2006, 2007, 2008, 2009, 2010 • AMS Sat Met – 2007, 2009 • AGU Fall – 2005, 2007, 2008, 2009 • SPIE Photonics – 2007, 2008, 2008, 2009 • EUMETSAT – 2008 (workshop), 2009 • ITWG/ITSC – 2007, 2008, 2010 (workshop) • NOAA DB - 2008 McIDAS-V Future Work • Continue to build upon the existing capabilities of VisAD/IDV/HYDRA - incorporate new ideas to add functionality • Act upon McIDAS Advisory Council priorities - we need an active MAC team • Provide an open environment for developing algorithms and new visualizations that take advantage of multi and hyper-spectral data from emerging observing systems McIDAS-V Future Work • Support the development of applications for the NPP/NPOESS and GOES R science teams • Advance data management and accessibility – develop a broad array of formats and services • Expand documentation and training materials • Encourage and support a vigorous User Forum •Cloud Isosurface with IR Temperature and In-Cloud Ice Content •WRF Cloud Water Isosurface Colored By Synthetic 2 km GOES-R ABI IR Window Brightness Temperatures •WRF Cloud Water Isosurface Colored by WRF 3-D Temperature Field •2-3 km Above Surrounding Anvil Cloud •2 km WRF Cloud Ice Content •200 hPa •175 hPa •150 hPa • We used these visualizations to learn that a single overshooting top (OT) is < 15 km in diameter and is co-located with significant vertical transport of ice into the stratosphere. Stratospheric ice content can be used to validate the accuracy of OT detections from synthetic GOES-R ABI imagery •Cloud Isosurface Animation With Synthetic ABI IR Temperature • We used these WRF simulations and visualizations to learn that a single overshooting top persists for ≤ 15 mins and that gravity waves can propagate far away (> 50 km) from their source region, representing a turbulence hazard for aviation interests GOES-12 and GOES-R ABI Simulation of Grand Prix Fire/Southern California •GOES-12 •GOES-R ABI •GOES-12 •GOES-R ABI ABI Band differencing (NDVI) – Can compute band difference on the fly – Band 03 (0.86um) - Band 02 (0.64um) ABI Data Transects in McIDAS-V An Update on McIDAS-V Planning and Development Tom Achtor McIDAS Users’ Group Meeting Madison, WI – 3 June 2009 Space Science & Engineering Center (SSEC) at the University of Wisconsin - Madison
