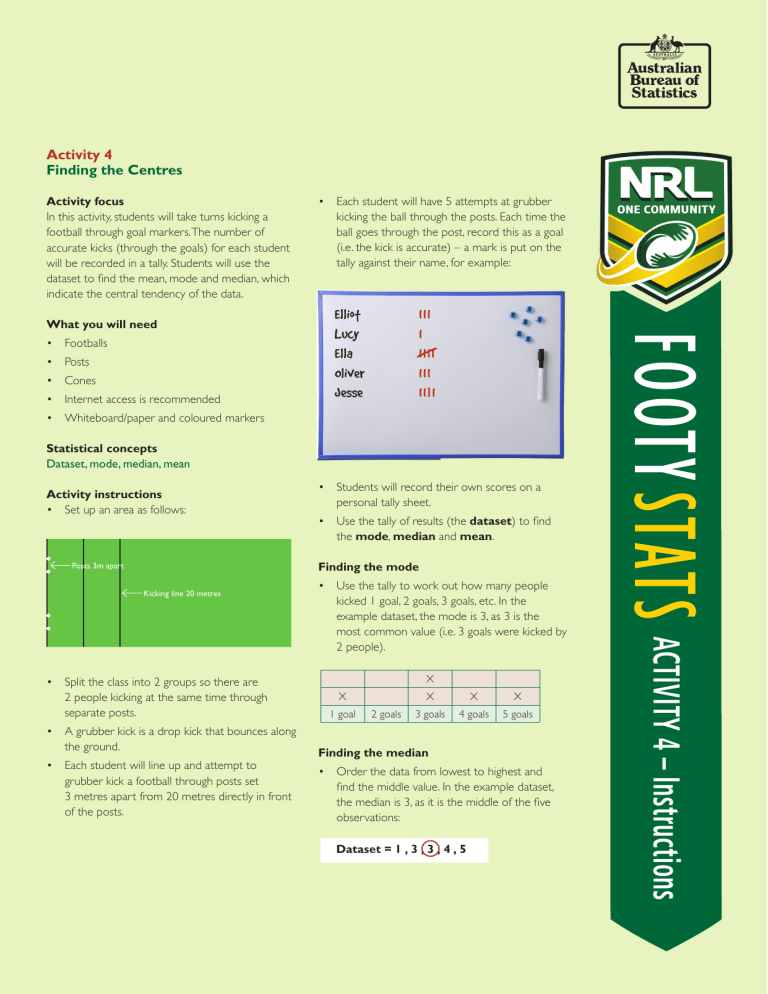
Activity 4 Finding the Centres

Activity 4
Finding the Centres
Activity focus
In this activity, students will take turns kicking a football through goal markers. The number of accurate kicks (through the goals) for each student will be recorded in a tally. Students will use the dataset to find the mean, mode and median, which indicate the central tendency of the data.
What you will need
• Footballs
• Posts
• Cones
• Internet access is recommended
• Whiteboard/paper and coloured markers
Statistical concepts
Dataset, mode, median, mean
Activity instructions
• Set up an area as follows:
• Each student will have 5 attempts at grubber kicking the ball through the posts. Each time the ball goes through the post, record this as a goal
(i.e. the kick is accurate) – a mark is put on the tally against their name, for example:
Elliot
Lucy
Ella
Oliver
Jesse
III
I I
IIII
III
IIlI
Posts 3m apart
Kicking line 20 metres
• Students will record their own scores on a personal tally sheet.
• Use the tally of results (the dataset ) to find the mode , median and mean .
Finding the mode
• Use the tally to work out how many people kicked 1 goal, 2 goals, 3 goals, etc. In the example dataset, the mode is 3, as 3 is the most common value (i.e. 3 goals were kicked by
2 people).
• Split the class into 2 groups so there are
2 people kicking at the same time through separate posts.
• A grubber kick is a drop kick that bounces along the ground.
• Each student will line up and attempt to grubber kick a football through posts set
3 metres apart from 20 metres directly in front of the posts.
X
X
X X X
1 goal 2 goals 3 goals 4 goals 5 goals
Finding the median
• Order the data from lowest to highest and find the middle value. In the example dataset, the median is 3, as it is the middle of the five observations:
Dataset = 1 , 3 , 3 , 4 , 5


