Top five Fields of Study in 2011
advertisement

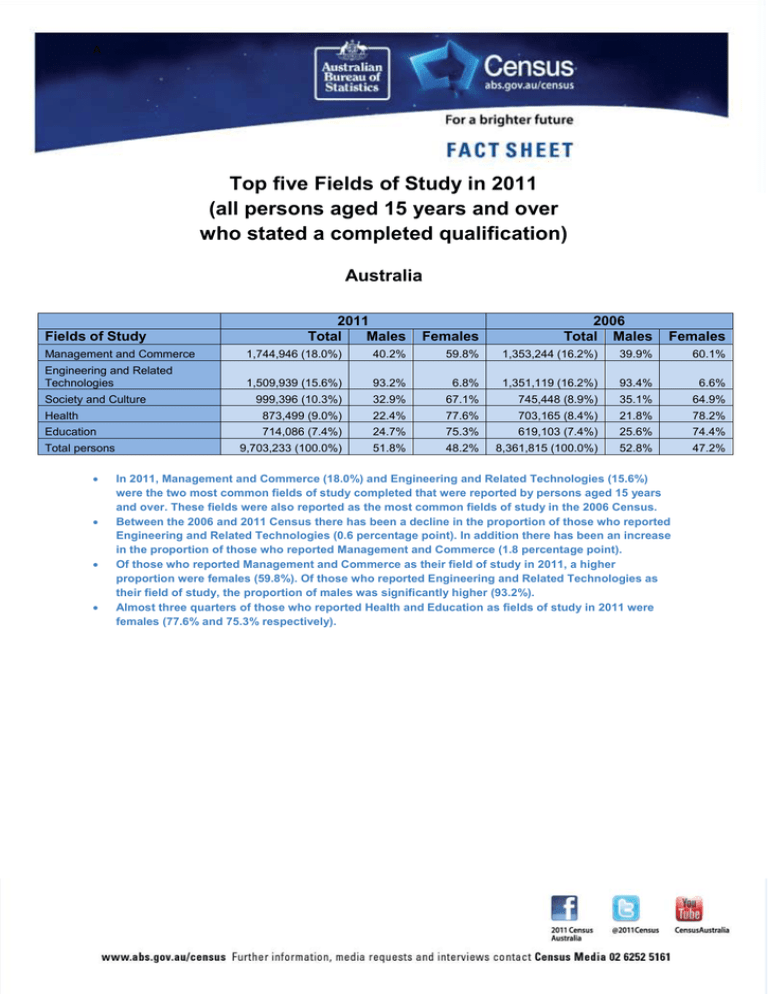
A Top five Fields of Study in 2011 (all persons aged 15 years and over who stated a completed qualification) Australia Fields of Study 2011 Total Males Females 2006 Total Males Females Management and Commerce 1,744,946 (18.0%) 40.2% 59.8% 1,353,244 (16.2%) 39.9% 60.1% Engineering and Related Technologies 1,509,939 (15.6%) 93.2% 6.8% 1,351,119 (16.2%) 93.4% 6.6% 999,396 (10.3%) 32.9% 67.1% 745,448 (8.9%) 35.1% 64.9% 873,499 (9.0%) 22.4% 77.6% 703,165 (8.4%) 21.8% 78.2% 714,086 (7.4%) 24.7% 75.3% 619,103 (7.4%) 25.6% 74.4% 9,703,233 (100.0%) 51.8% 48.2% 8,361,815 (100.0%) 52.8% 47.2% Society and Culture Health Education Total persons In 2011, Management and Commerce (18.0%) and Engineering and Related Technologies (15.6%) were the two most common fields of study completed that were reported by persons aged 15 years and over. These fields were also reported as the most common fields of study in the 2006 Census. Between the 2006 and 2011 Census there has been a decline in the proportion of those who reported Engineering and Related Technologies (0.6 percentage point). In addition there has been an increase in the proportion of those who reported Management and Commerce (1.8 percentage point). Of those who reported Management and Commerce as their field of study in 2011, a higher proportion were females (59.8%). Of those who reported Engineering and Related Technologies as their field of study, the proportion of males was significantly higher (93.2%). Almost three quarters of those who reported Health and Education as fields of study in 2011 were females (77.6% and 75.3% respectively). A Top five Fields of Study in 2011 (all persons aged 15 years and over who stated a completed qualification) States and Territories Fields of Study New South Wales 2011 Total Males Females 2006 Total Males Females Management and Commerce 647,875 (20.3%) 39.7% 60.3% 525,056 (18.4%) 38.8% 61.2% Engineering and Related Technologies 471,736 (14.8%) 92.6% 7.4% 442,431 (15.5%) 92.8% 7.2% Society and Culture 325,402 (10.2%) 35.1% 64.9% 249,003 (8.7%) 37.7% 62.3% 271,405 (8.5%) 23.2% 76.8% 227,949 (8.0%) 22.7% 77.3% 228,393 (7.1%) 24.9% 75.1% 200,582 (7.0%) 25.7% 74.3% 3,196,923 (100.0%) 51.3% 48.7% 2,860,459(100.0%) 52.3% 47.7% 2006 Total Males Females Health Education Total persons Fields of Study Victoria 2011 Total Males Females Management and Commerce 434,724 (17.8%) 43.3% 56.7% 330,061 (15.8%) 43.2% 56.8% Engineering and Related Technologies 354,935 (14.5%) 92.2% 7.8% 322,173 (15.4%) 92.5% 7.5% Society and Culture 259,366 (10.6%) 31.2% 68.8% 191,841 (9.2%) 33.2% 66.8% 222,101 (9.1%) 21.6% 78.4% 178,893 (8.5%) 21.2% 78.8% 182,544 (7.5%) 25.7% 74.3% 159,802 (7.6%) 26.5% 73.5% 2,443,534 (100.0%) 51.1% 48.9% 2,092,406 (100.0%) 52.1% 47.9% 2006 Total Males Females Health Education Total persons Fields of Study Queensland 2011 Total Males Females Engineering and Related Technologies 314,630 (16.8%) 94.4% 5.6% 269,402 (17.3%) 94.8% 5.2% Management and Commerce 310,801 (16.6%) 37.4% 62.6% 228,738 (14.7%) 37.9% 62.1% Society and Culture 180,558 (9.6%) 31.1% 68.9% 128,353 (8.2%) 33.1% 66.9% Health 173,990 (9.3%) 22.9% 77.1% 131,993 (8.5%) 22.3% 77.7% Education 139,977 (7.5%) 23.5% 76.5% 119,072 (7.6%) 24.6% 75.4% 1,875,324 (100.0%) 52.7% 47.3% 1,560,869 (100.0%) 53.9% 46.1% Total persons A Top five Fields of Study in 2011 (all persons aged 15 years and over who stated a completed qualification) States and Territories Fields of Study South Australia 2011 Total Males Females 2006 Total Males Females Engineering and Related Technologies 114,301 (16.8%) 94.0% 6.0% 106,747 (17.9%) 94.1% 5.9% Management and Commerce 110,386 (16.2%) 41.6% 58.4% 85,445 (14.4%) 42.3% 57.7% Society and Culture 74,783 (11.0%) 32.2% 67.8% 55,356 (9.3%) 34.1% 65.9% Health 73,303 (10.8%) 21.7% 78.3% 59,927 (10.1%) 20.9% 79.1% 49,825 (7.3%) 27.6% 72.4% 44,578 (7.5%) 28.1% 71.9% 680,210 (100.0%) 52.1% 47.9% 595,382 (100.0%) 53.3% 46.7% 2006 Total Males Females Education Total persons Fields of Study Western Australia 2011 Total Males Females Engineering and Related Technologies 189,627 (18.6%) 94.1% 5.9% 152,071 (18.3%) 94.3% 5.7% Management and Commerce 163,809 (16.1%) 38.9% 61.1% 123,249 (14.8%) 38.8% 61.2% Society and Culture 91,832 (9.0%) 30.9% 69.1% 68,028 (8.2%) 32.5% 67.5% Health 91,391 (9.0%) 21.9% 78.1% 70,690 (8.5%) 20.8% 79.2% 76,868 (7.5%) 21.7% 78.3% 62,699 (7.5%) 23.6% 76.4% 1,020,181 (100.0%) 53.5% 46.5% 831,622 (100.0%) 53.6% 46.4% 2006 Total Males Females Education Total persons Fields of Study Tasmania 2011 Total Males Females Engineering and Related Technologies 32,643 (15.9%) 93.9% 6.1% 29,717 (16.2%) 93.9% 6.1% Management and Commerce 29,479 (14.3%) 36.5% 63.5% 23,530 (12.8%) 37.7% 62.3% Society and Culture 22,250 (10.8%) 28.8% 71.2% 16,654 (9.1%) 30.7% 69.3% 19,908 (9.7%) 21.4% 78.6% 16,419 (9.0%) 21.3% 78.7% 16,932 (8.2%) 26.3% 73.7% 15,202 (8.3%) 26.3% 73.7% 205,759 (100.0%) 51.6% 48.4% 183,244 (100.0%) 52.7% 47.3% Health Education Total persons A Top five Fields of Study in 2011 (all persons aged 15 years and over who stated a completed qualification) States and Territories Fields of Study Northern Territory 2011 Total Males Females 2006 Total Males Females Engineering and Related Technologies 32,643 (15.9%) 93.9% 6.1% 29,717 (16.2%) 93.9% 6.1% Management and Commerce 29,479 (14.3%) 36.5% 63.5% 23,530 (12.8%) 37.7% 62.3% Society and Culture 22,250 (10.8%) 28.8% 71.2% 16,654 (9.1%) 30.7% 69.3% Health 19,908 (9.7%) 21.4% 78.6% 16,419 (9.0%) 21.3% 78.7% Education 16,932 (8.2%) 26.3% 73.7% 15,202 (8.3%) 26.3% 73.7% 205,759 (100.0%) 51.6% 48.4% 183,244 (100.0%) 52.7% 47.3% 2006 Total Males Females Total persons Fields of Study Australian Capital Territory 2011 Total Males Females Society and Culture 36,390 (19.4%) 42.0% 58.0% 29,659 (18.5%) 44.1% 55.9% Management and Commerce 59.1% 28,025 (17.5%) 40.0% 60.0% 35,542 (19.0%) 40.9% Engineering and Related Technologies 17,987 (9.6%) 90.9% 9.1% 16,351 (10.2%) 91.4% 8.6% Health 13,632 (7.3%) 22.5% 77.5% 11,371 (7.1%) 21.1% 78.9% 12,846 (6.8%) 24.1% 75.9% 11,586 (7.2%) 24.5% 75.5% 187,556 (100.0%) 50.4% 49.6% 160,593 (100.0%) 51.0% 49.0% Education Total persons A Top five Fields of Study in 2011 (all persons aged 15 years and over who stated a completed qualification) Capital Cities Fields of Study Sydney 2011 Total Males Females Management and Commerce 482,531 (22.8%) 42.4% Engineering and Related Technologies 283,396 (13.4%) Society and Culture 228,102 (10.8%) Health Education Total persons Fields of Study 2006 Total Males Females 57.6% 388,322 (20.5%) 41.5% 91.0% 9.0% 268,322 (14.1%) 91.5% 8.5% 37.1% 62.9% 178,196 (9.4%) 39.3% 60.7% 163,892 (7.8%) 25.4% 74.6% 137,693 (7.3%) 24.8% 75.2% 138,492 (6.6%) 23.4% 76.6% 122,073 (6.4%) 23.9% 76.1% 2,112,431 (100%) 51.0% 49.0% 1,897,502 (100%) 51.8% 48.2% 2006 Total Males Females Melbourne 2011 Total Males Females 58.5% Management and Commerce 364,973 (19.4%) 44.4% 55.6% 276,038 (17.2%) 44.4% 55.6% Engineering and Related Technologies Society and Culture 265,339 (14.1%) 205,434 (10.9%) 91.3% 32.7% 8.7% 67.3% 240,286 (15.0%) 154,216 (9.6%) 91.8% 34.4% 8.2% 65.6% Health 160,369 (8.5%) 23.0% 77.0% 128,027 (8.0%) 22.5% 77.5% Education 131,572 (7.0%) 24.3% 75.7% 114,929 (7.2%) 25.1% 74.9% 1,878,423 (100%) 51.0% 49.0% 1,601,819 (100%) 51.9% 48.1% 2006 Total Males Females Total persons Fields of Study Brisbane 2011 Total Males Females Management and Commerce 173,467 (18.8%) 40.4% Engineering and Related Technologies 146,412 (15.8%) 99,566 (10.8%) Health Education Society and Culture Total persons 59.6% 127,419 (16.6%) 40.6% 59.4% 93.3% 6.7% 125,554 (16.3%) 94.1% 5.9% 33.4% 66.6% 72,415 (9.4%) 34.8% 65.2% 86,881 (9.4%) 23.7% 76.3% 66,520 (8.7%) 23.3% 76.7% 66,987 (7.2%) 23.3% 76.7% 57,277 (7.5%) 24.3% 75.7% 924,972 (100%) 52.0% 48.0% 768,020 (100%) 53.1% 46.9% A Top five Fields of Study in 2011 (all persons aged 15 years and over who stated a completed qualification) Capital Cities Fields of Study Adelaide 2011 Total Males Females 2006 Total Males Females Management and Commerce 93,395 (17.2%) 43.0% 57.0% 72,544 (15.3%) 43.6% 56.4% Engineering and Related Technologies 87,470 (16.1%) 93.5% 6.5% 82,826 (17.5%) 93.6% 6.4% Society and Culture 62,628 (11.6%) 33.6% 66.4% 47,221 (10.0%) 35.0% 65.0% Health 59,541 (11.0%) 23.2% 76.8% 48,389 (10.2%) 22.4% 77.6% 39,009 (7.2%) 28.2% 71.8% 34,823 (7.3%) 28.7% 71.3% 541,731 (100%) 51.8% 48.2% 474,082 (100%) 53.0% 47.0% 2006 Total Males Females Education Total persons Fields of Study Perth 2011 Total Males Females Engineering and Related Technologies 144,956 (18.0%) 93.6% 6.4% 118,600 (17.9%) 94.0% 6.0% Management and Commerce 139,649 (17.3%) 40.2% 59.8% 105,300 (15.9%) 40.2% 59.8% 77,382 (9.6%) 31.8% 68.2% 57,947 (8.7%) 33.3% 66.7% 73,966 (9.2% 22.7% 77.3% 57,060 (8.6%) 21.9% 78.1% 60,071 (7.5%) 21.9% 78.1% 48,804 (7.4%) 23.9% 76.1% 805,649 (100%) 52.7% 47.3% 662,741 (100%) 53.3% 46.7% Hobart 2011 Total Males Females 2006 Total Males Females Society and Culture Health Education Total persons Fields of Study Management and Commerce 14,840 (15.7%) 39.9% 60.1% 11,712 (14.0%) 41.4% 58.6% Engineering and Related Technologies 12,871 (13.6%) 93.0% 7.0% 11,824 (14.1%) 93.1% 6.9% Society and Culture 11,593 (12.3%) 32.3% 67.7% 9,061 (10.8%) 34.4% 65.6% 9,392 (10.0%) 22.6% 77.4% 7,789 (9.3%) 22.8% 77.2% 7,677 (8.1%) 26.7% 73.3% 6,835 (8.2%) 26.8% 73.2% 94,381 (100%) 51.0% 49.0% 83,863 (100%) 52.1% 47.9% Health Education Total persons A Top five Fields of Study in 2011 (all persons aged 15 years and over who stated a completed qualification) Capital Cities Fields of Study Darwin 2011 Total Males Females 2006 Total Males Females Engineering and Related Technologies 9,432 (16.0%) 94.2% 5.8% 8,002 (16.9%) 95.1% 4.9% Management and Commerce 8,706 (14.8%) 35.3% 64.7% 6,352 (13.4%) 35.3% 64.7% Society and Culture 5,727 (9.7%) 33.7% 66.3% 4,390 (9.3%) 35.5% 64.5% Health 4,749 (8.1%) 23.7% 76.3% 3,566 (7.5%) 22.2% 77.8% Education 3,770 (6.4%) 24.1% 75.9% 3,273 (6.9%) 26.4% 73.6% 58,791 (100%) 54.6% 45.4% 47,331 (100%) 55.0% 45.0% 2006 Total Males Females Total persons Fields of Study Canberra 2011 Total Males Females Society and Culture 36,308 (19.4%) 42.1% 57.9% 29,595 (18.5%) 44.1% 55.9% Management and Commerce 59.1% 27,968 (17.5%) 40.0% 60.0% 35,480 (19.0%) 40.9% Engineering and Related Technologies 17,963 (9.6%) 90.8% 9.2% 16,326 (10.2%) 91.4% 8.6% Health 13,597 (7.3%) 22.5% 77.5% 11,341 (7.1%) 21.1% 78.9% 12,825 (6.9%) 24.1% 75.9% 11,572 (7.2%) 24.5% 75.5% 187,170 (100%) 50.4% 49.6% 160,242 (100%) 51.0% 49.0% Education Total persons


