MWH Global QuickRead Report June 2015
advertisement
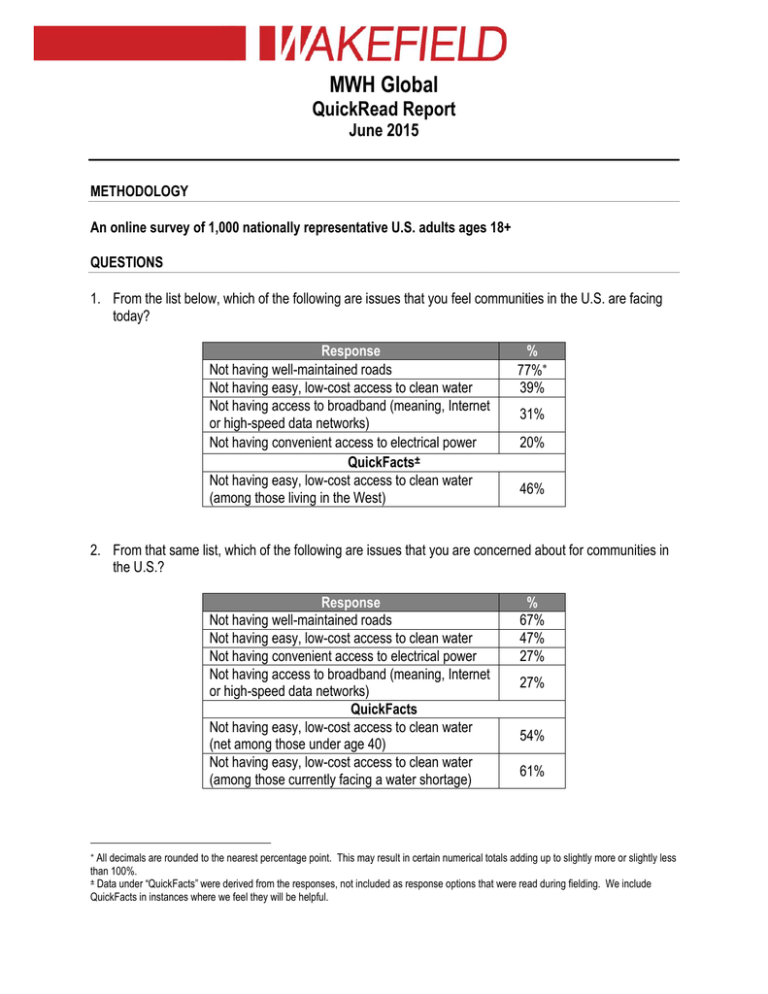
MWH Global QuickRead Report June 2015 METHODOLOGY An online survey of 1,000 nationally representative U.S. adults ages 18+ QUESTIONS 1. From the list below, which of the following are issues that you feel communities in the U.S. are facing today? Response Not having well-maintained roads Not having easy, low-cost access to clean water Not having access to broadband (meaning, Internet or high-speed data networks) Not having convenient access to electrical power QuickFacts± Not having easy, low-cost access to clean water (among those living in the West) % 77% 39% 31% 20% 46% 2. From that same list, which of the following are issues that you are concerned about for communities in the U.S.? Response Not having well-maintained roads Not having easy, low-cost access to clean water Not having convenient access to electrical power Not having access to broadband (meaning, Internet or high-speed data networks) QuickFacts Not having easy, low-cost access to clean water (net among those under age 40) Not having easy, low-cost access to clean water (among those currently facing a water shortage) % 67% 47% 27% 27% 54% 61% All decimals are rounded to the nearest percentage point. This may result in certain numerical totals adding up to slightly more or slightly less than 100%. ± Data under “QuickFacts” were derived from the responses, not included as response options that were read during fielding. We include QuickFacts in instances where we feel they will be helpful. Wakefield Research MWH Global QuickRead Report June 2015 3. In general, do you feel that water shortages for communities in the U.S. will happen more often or less often in the coming 10 years? Response They will happen much more often They will happen somewhat more often They will happen somewhat less often They will happen much less often The likelihood of water shortages will remain exactly the same QuickFacts More often (net) Less often (net) More often (net among those currently facing a water shortage) % 32% 38% 8% 3% 19% 70% 11% 89% 4. How likely or unlikely do you think it is that your community, or nearby communities, will face a water shortage within the next five years? Response We are already experiencing a shortage Definitely will Very likely Somewhat likely Somewhat unlikely Very unlikely Definitely will not QuickFacts Likely (net) Unlikely (net) Likely (net among those ages 25-39) % 12% 9% 15% 24% 20% 13% 6% 49% 39% 59% 4a. (Among those who are not already experiencing a water shortage) Response Definitely will Very likely Somewhat likely Somewhat unlikely Very unlikely Definitely will not % 11% 17% 28% 23% 15% 7% QuickFacts Likely (net) Unlikely (net) 56% 44% Page 2 of 5 Wakefield Research MWH Global QuickRead Report June 2015 5. How much, if at all, do you think day-to-day life in your community would change if you were forced to cut back on water usage because of a shortage? Response Significantly Somewhat Not very much Not at all QuickFacts Significantly (among those currently facing a water shortage) % 34% 48% 15% 3% 59% 6. Approximately how much longer do you think your community’s current water infrastructure will last? For example, water treatment facilities, sewers or pipelines. Response Less than one year 1-5 years 6-10 years 11-19 years 20+ years QuickFacts Average (years) Less than five years (net) % 23% 20% 19% 6% 32% 16 33% 7. In your opinion, should your community be spending more or less money to make sure its water infrastructure is well-maintained and properly functioning? Response Much more Somewhat more Somewhat less Much less Exactly the same amount QuickFacts More (net) Less (net) More (net among those currently facing a water shortage) Page 3 of 5 % 19% 47% 10% 1% 23% 66% 11% 81% Wakefield Research MWH Global QuickRead Report June 2015 8. How strongly do you support or oppose the development of additional infrastructure to increase and maintain clean water access in your community? Response Strongly support Somewhat support Somewhat oppose Strongly oppose QuickFacts Support (net) Oppose (net) % 36% 55% 7% 2% 91% 9% 9. Would you support or oppose paying higher utility rates to support the development and enhancement of the water infrastructure in your community? Response Strongly support Somewhat support Somewhat oppose Strongly oppose QuickFacts Support (net) Oppose (net) Support (net among those ages 25-39) Support (net among those currently facing a water shortage) % 17% 44% 26% 13% 61% 39% 70% 75% 10. Which of the following actions, if any, would you be likely to take if your community experienced a sustained problem with its water? Meaning a problem with the sewer system or one that affected safe, accessible drinking water. Response Lobby for updated conservation laws Lobby for utility rate increases to fund new infrastructure projects Move to a new area Other None of these QuickFacts Any (net) Page 4 of 5 % 35% 26% 24% 4% 32% 68% Wakefield Research MWH Global QuickRead Report June 2015 Methodological Notes: The MWH Global Survey was conducted by Wakefield Research (www.wakefieldresearch.com) among 1,000 nationally representative U.S. adults ages 18+, between May 28th and June 3rd, 2015, using an email invitation and an online survey. Quotas have been set to ensure reliable and accurate representation of the U.S. adults ages 18+. Results of any sample are subject to sampling variation. The magnitude of the variation is measurable and is affected by the number of interviews and the level of the percentages expressing the results. For the interviews conducted in this particular study, the chances are 95 in 100 that a survey result does not vary, plus or minus, by more than 3.1 percentage points from the result that would be obtained if interviews had been conducted with all persons in the universe represented by the sample. Page 5 of 5
