Forest Nursery Notes by Thomas D. Landis, Jeremy R. Pinto, and
advertisement
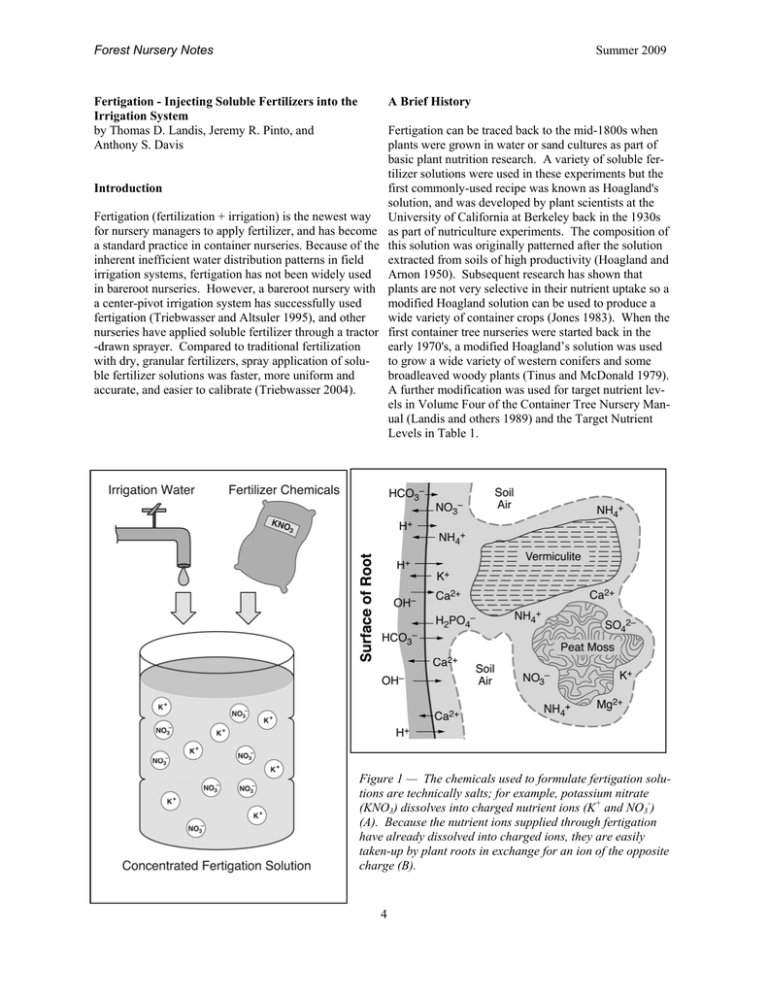
Forest Nursery Notes Summer 2009 Fertigation - Injecting Soluble Fertilizers into the Irrigation System by Thomas D. Landis, Jeremy R. Pinto, and Anthony S. Davis A Brief History Fertigation can be traced back to the mid-1800s when plants were grown in water or sand cultures as part of basic plant nutrition research. A variety of soluble fertilizer solutions were used in these experiments but the first commonly-used recipe was known as Hoagland's solution, and was developed by plant scientists at the University of California at Berkeley back in the 1930s as part of nutriculture experiments. The composition of this solution was originally patterned after the solution extracted from soils of high productivity (Hoagland and Arnon 1950). Subsequent research has shown that plants are not very selective in their nutrient uptake so a modified Hoagland solution can be used to produce a wide variety of container crops (Jones 1983). When the first container tree nurseries were started back in the early 1970's, a modified Hoagland’s solution was used to grow a wide variety of western conifers and some broadleaved woody plants (Tinus and McDonald 1979). A further modification was used for target nutrient levels in Volume Four of the Container Tree Nursery Manual (Landis and others 1989) and the Target Nutrient Levels in Table 1. Introduction Fertigation (fertilization + irrigation) is the newest way for nursery managers to apply fertilizer, and has become a standard practice in container nurseries. Because of the inherent inefficient water distribution patterns in field irrigation systems, fertigation has not been widely used in bareroot nurseries. However, a bareroot nursery with a center-pivot irrigation system has successfully used fertigation (Triebwasser and Altsuler 1995), and other nurseries have applied soluble fertilizer through a tractor -drawn sprayer. Compared to traditional fertilization with dry, granular fertilizers, spray application of soluble fertilizer solutions was faster, more uniform and accurate, and easier to calibrate (Triebwasser 2004). Figure 1 — The chemicals used to formulate fertigation solutions are technically salts; for example, potassium nitrate (KNO3) dissolves into charged nutrient ions (K+ and NO3-) (A). Because the nutrient ions supplied through fertigation have already dissolved into charged ions, they are easily taken-up by plant roots in exchange for an ion of the opposite charge (B). 4 Forest Nursery Notes Summer 2009 Table 1 — Nutrient analysis of irrigation water from diverse forest and conservation nurseries compared to recommended mineral nutrient target concentrations (modifed from Landis 1997) Essential Mineral Nutrients Target * Nutrient Levels Irrigation Water Analysis Hawaii Nursery Colorado Nursery California Nursery Idaho Nursery Macronutrients in parts per million Total Nitrogen (N) 200 Not Tested 3 7 2 Nitrate-nitrogen (NO3) 150 Not Tested 3 5 2 Ammoniumnitrogen (NH4) 50 Not Tested 0 0 0 Phosphorus (P) 60 0 0 0 0 Potassium (K) 160 0 2 2 4 Calcium (Ca) 60 1 82 66 26 Magnesium (Mg) 40 1 14 113 9 Sulfate-sulfur (SO4) 60 Not Tested 43 315 13 Micronutrients in parts per million Iron (Fe) 4.00 0.20 0.00 0.00 0.09 Manganese (Mn) 0.50 0.00 0.00 0.01 0.03 Zinc (Zn) 0.05 0.00 0.00 0.05 0.34 Copper (Cu) 0.02 0.00 0.00 0.00 0.00 Chloride (Cl) 4.00 Not Tested 3.00 132.00 2.52 Molybdenum (Mo) 0.01 Not Tested 0.00 0.00 0.00 Boron (B) 0.50 0.00 0.06 1.00 0.00 1610 186 Total Dissolved Salts in mS/cm Electrical Conductivity 1200 to 1800 30 470 * = Target N levels will vary with plant species and nursery growth phase 5 Forest Nursery Notes Summer 2009 2. Frequent mixing and applying of liquid fertilizers increases labor costs. Mineral Nutrient Uptake The chemicals used to make soluble fertilizers for fertigation are technically salts, which means that they readily dissolve in water into charged ions. For example, potassium nitrate (KNO3) dissolves into two nutrient ions: the cation potassium (K+) and the anion nitratenitrogen (NO3-) (Figure 1A). One of the benefits of fertigation is that all the mineral nutrients are already in an ionic form when they are applied to the crop. With other granular or controlled release fertilizers, the nutrients must first dissolve in the ground water before they become available for plant uptake (Figure 1B). 3. A well-designed, automated irrigation system is essential to ensure even fertilizer application. 4. Excessive fertigation can damage nursery crops and pollute the environment. Three Components of a Fertigation System Fertigation should be thought of as a system with 3 major components (Figure 2), which should be considered in reverse order of how they actually occur: Like most cultural practices, fertigation has both advantages and disadvantages (Landis and others 1989): 1. Applied fertigation solution This is the most important component because it is what actually reaches the plants. Checking the pH and EC of the applied fertigation solution shows how well the entire system is working, and should be done at least weekly. The concentration of the 13 mineral nutrients in the applied solution should be close to the target nutrient levels that you’ve selected for your crop. The ideal nutrient concentration will vary with the plant species that you are growing, and also with the phase of crop development. Have the applied fertigation solution tested by a laboratory at least once a season, and compare to the target nutrient levels. Advantages: 1. Fertigation allows precise control of both the concentration and balance of all 13 mineral nutrients. 2. Nutrient solutions can easily be customized or modified for any plant growth stage or species. 3. When properly formulated and applied, the chance of excessive fertilization and resultant salt injury is low. 4. Fertigation solutions are easily to monitor. Nitrogen (N) is one of the most important nutrients affecting plant growth and is the most frequently applied fertilizer element. Therefore, all fertigation programs are based around the N concentration, and the levels of all the other nutrients are established relative to N. Disadvantages: 1. Nutrient injectors must be used for maximum effectiveness. Figure 2 — The three major components of any fertigation system are: A) nutrient concentrations in the applied fertigation solution , B) base level of nutrients in the irrigation water, and C) composition of the concentrated fertigation stock solution (modified from Nelson 1978). 6 Forest Nursery Notes Summer 2009 Each of the 3 growth phases for container nursery crops has its own N target concentration ( Landis and others 1999): The mineral nutrient content of three very different water sources is presented in Table 1. In Hawaii, rain filters through young, pumice soils that do not contain many soluble minerals and so the irrigation water is very Establishment phase: 25 to 50 ppm N — All nutrient pure. Actually, such irrigation water can be too pure for levels are kept low to allow the young seedlings to begood plant growth because it quickly leaches out the come established in the container without risk of salt soluble nutrients from the soil or growing medium — injury. Phosphorus (P) is important because very little this same thing happens in open growing compounds of this nutrient is stored in the seed and the new roots during periods of heavy rainfall. The water at many have limited absorption ability. Calcium (Ca) is also places in the semi-arid Western US, such as Colorado, is important for new root growth. called “hard” because it contains high levels of Ca and Mg that cause scale deposits on pipes and other surfaces. Rapid growth phase: 75 to 200 ppm N — This is the Nurseries with moderately hard water are fortunate beperiod of rapid shoot growth and the target N concentra- cause it often supplies all or most of the plant’s Ca and tion will vary with crop characteristics, and how well Mg requirement. Water from some irrigation wells can shoot growth is occurring relative to the desired growth be too high in soluble salts, as the analysis from the Saccurves. Fast growing species, such as quaking aspen or ramento Valley of California illustrates. Although their sagebrush, are given 50 ppm N to prevent excessive Ca, Mg, and S levels are above the recommended levels, height growth. N levels of 75 to 150 ppm will be suffi- the most serious factor is direct toxicity from high chlocient for most native plant species. Some very slow ride levels (Table 1). growing plants, such as whitebark pine (Pinus albicaulus), may require 200 ppm N or more to force growth. Mineral nutrient analyses of irrigation water can be performed by most analytical testing laboratories, but growHardening phase: 50 to 75 ppm N — High N levels, ers should be sure to specify that they want a nutrient and ammonium-N in particular, stimulate shoot growth analysis, instead of a standard water quality test. It’s a at the expense of stem or root growth, can be detrimen- good idea to supply a list of the nutrients from Table 1 tal to cold hardiness development. Therefore, target N that you want tested. A complete water analysis for levels are kept at low concentrations during the harden- both nutrients and quality should cost around USD $50 ing phase. The purported benefit of high potassium (K) to $100, and many labs will E-mail results in around a during hardening has never been proven but higher Ca week. The pH and electrical conductivity (EC) of the levels aid in the hardening process. water should also be measured. The pH gives an indication of how much acid will be required to reach the de2. Irrigation water quality sired 5.5 level, and the EC reflects the total dissolved Water quality has a major influence on any fertigation salts. program. The most important considerations are the total salt level, as measured by electrical conductivity (EC), Acidify irrigation water pH to target level — Once and the mineral nutrient concentrations in the water that the base nutrient level of the water is known, its bufferwill be applied to your crop (Table 1). ing capacity should be determined by acid titration. Titration is a process in which small increments of an Nutrients in the irrigation water — Most people don’t acid are added to a known quantity of irrigation water (1 consider water a source of nutrients and, if they are talk- liter) to determine the amount of acid that will be required to lower the pH to the desired level (pH 5.5). ing about animal nutrition, then that’s correct. For Titrations can be done by any water testing lab or by plants, however, irrigation water can be a valuable nursery personnel using a pH meter and a burette or source of secondary mineral nutrients. In fact, some irrigation waters can contain all or a substantial portion pipette. Any acid can be used for titrating as long as its of the (Ca), magnesium (Mg), and sulfur (S) needed for normality is known so that conversions between different acids can be made. The floriculture department at normal growth. The concentrations of soluble mineral North Carolina State University has posted a spreadnutrients in irrigation water vary considerably from sheet on their website that allows growers to calculate nursery to nursery depending on the water source and the amount of acid to inject to neutralize alkalinty in the local geology. Because it has had less time to dissolve soluble minerals in the soil, irrigation water from their irrigation water. Users can specify their choice of sulfuric, nitric, and phosphoric acid as well as their tarsurface sources such as streams and ponds will usually get pH at the following website: http://www.ces.ncsu have lower soluble salt levels than well water. Water .edu/depts/hort/floriculture/software/alk.html quality can also vary seasonally, especially if different wells are used. 7 Forest Nursery Notes Summer 2009 Several acids have been used for acid injection in container tree nurseries including nitric, sulfuric, and phosphoric but we prefer phosphoric acid (H3PO4) because it is relatively safe to handle. An added benefit is that the acidified water produces a constant source of soluble phosphorus, which is particularly valuable during germination and early growth. Sometimes, when irrigation water is very alkaline (high pH), so much phosphoric acid is required that the P level would exceed the target level of 60 ppm (Table 1). In this situation, a stronger acid such as nitric acid can be used ,or even acetic acid, which is safe and contributes no nutrient ions. Another consideration is to be sure that your fertilizer injector is equipped to tolerate acids. Figure 3 — Acid titration curves for two different nurseries in Colorado which were developed by adding successive 1 ml increments of 1 % phosphoric acid H3PO4 to 1 liter of irrigation water (Landis and others 1989). To keep calculations simple and safe, we use a 1% phosphoric acid solution for our titrations. Both 75 or 85% phosphoric acid are commercially available, and the calculations to make the 1% solution are proportional (Table 2). Once the amount of 1% H3PO4 needed to lower the pH of the water sample is known, the conversion to back to the 75 or 85% stock acid solution is made by dividing by either 75 or 85. 3. Formulating fertilizer stock solutions At this step, you have 2 options. The first is to use a commercial soluble fertilizer, and the second is to create a custom fertilizer from stock chemicals. We recommend using plastic containers for the concentrated fertilizer solutions to avoid corrosion, and most nurseries use 50 gallon (200 liter) tanks. Titration curves for the irrigation water at two forest nurseries in Colorado are given in Figure 3. Note the difference between the two curves: the steeper the slope of the line, the lower the buffering capacity of the water. The water at the Colorado State Nursery has a very low buffering capacity and requires only 3 ml of H3PO4 to lower the pH of 1 liter of irrigation water to the desired level, whereas the Mt. Sopris Nursery water requires almost 16 ml of 1 % H3PO4 to reach the target pH. One inherent problem with formulating concentrated stock solutions is solubility — the more concentrated the solution, the greater the risk of precipitation. Calcium in particular causes problems because it forms precipitates when it is combined with high concentrations of phosphorus and sulfur. The best practice is to use two separate tanks and a nutrient injector with 2 heads: the commercial fertilizer in the first, and the acid and any calcium and sulfate fertilizers in the second. Once the 2 solutions are mixed in the applied fertigation stream they have been diluted enough to prevent precipitation problems. For more information on fertilizer compati- Because the amount of acid may need to be adjusted for seasonal changes in water quality, regular pH monitoring is necessary. The pH will also change after the fertilizer chemicals have been added to the fertilizer solution, so other minor adjustments may be required. Table 2 — Calculations for making 1 liter of 1% phosphoric acid titrating solution from a 75% stock acid and distilled water Concentration x Volume = Concentration x Volume (0.01)(1,000 ml) = (0.75)(X) 10 = 0.75X X = 13.3 ml For safety reasons, always add acid to water: partially fill the flask with distilled water, slowly add the acid to it, and then add enough water to make 1 liter. 8 Forest Nursery Notes Summer 2009 sional® Conifer Grower (20-7-19) to add to 1 gallon of water is shown in Table 4. Note that all fertigation solutions are based on the parts per million of nitrogen. To calculate the concentrations of all the nutrients, use the following procedure, which is based on the fact that parts per million (ppm) is the same as milligrams per liter (mg/l): Table 3 — Elemental mineral nutrient concentration in an applied 100 ppm nitrogen solution of Peters Professional® Conifer Grower (modified from Scotts Company 2004) Mineral Nutrient (Symbol) ppm 1. Set the target N level for the applied fertilizer solution (100 ppm, for example). Macronutrients Total Nitrogen (N) 100 Ammoniacal-N (NH4 & NH3) (58) Nitrate-N (NO3) (42) 2. Determine how much bulk fertilizer must be used to produce the target concentration (100 ppm). The fertilizer in our example is 20-7-19, or 20% N. 100 ppm = 100 mg/l, but remember that this fertilizer is only 20% N. So, 100 mg of bulk fertilizer contains only 20 mg N: Phosphorus (P) 15 Potassium (K) 79 Calcium (Ca) 0 Magnesium (Mg) 4 Sulfur (S) 0 3. Adjust for the nutrient injection ratio (1:200, for example): Iron (Fe) 2.00 500 mg/l bulk fertilizer x 200 = 100,000 mg/l bulk fertilizer Manganese (Mn) 0.30 Zinc (Zn) 0.30 Copper (Cu) 0.30 Molybdenum (Mo) 0.02 Boron (B) 0.12 100 mg/l divided by 0.20 = 500 mg/l bulk fertilizer Micronutrients 4. Convert from milligrams per liter to grams per liter: 100,000 mg/l = 1,000 mg/g = 100 g/l bulk fertilizer If using English units, convert grams per liter to ounces per gallon: 100 g/l x 0.1334 = 13.34 ounces of bulk fertilizer per gallon of water (Note that this value agrees with the value in the mixing instructions in Table 4 for 100 ppm N and a 1:200 injector). bility, see Figure 4.1.22 in Volume Four of the Container Tree Nursery Manual (Landis and others 1989). Using commercial soluble fertilizers. When we wrote Volume Four: Seedling Nutrition and Irrigation of the Container Tree Nursery Manual, 88% of the container nurseries in North America used commercial brand fertilizers, either alone or in combination with custom mixes. Some fertilizer brands contain both macronutrients and micronutrients whereas others contain only the major fertilizer elements, so be sure and check the label. Nutrients supplied by a typical fertilizer (Peters Professional® Conifer Grower) at a 100 ppm N rate are listed in Table 3. Note that neither Ca nor S is supplied by the fertilizer due to solubility problems. If these nutrients are not sufficient in the irrigation water, then a second stock tank with calcium chloride and magnesium sulfate should be used. 5. Now that we have established the amount of 20-7-19 bulk fertilizer (step #2) needed to supply our N target (step #1), we need to calculate how much P will be contained in the applied fertilizer solution (note that the fertilizer contains 7% P2O5, NOT 7% P): 500 mg/l x 0.07 = 35 ppm 6. Now, we need to convert from the oxide form (P2O5) to the elemental form: 35 ppm P2O5 x 0.4364 = 15 ppm P Again, note that this agrees with the value in Table 4. Just to confirm, you can do similar calculations to compute the ppm of each of the mineral nutrients. Most commercial brands of soluble fertilizer will provide mixing instructions; the weight of Peters Profes9 Forest Nursery Notes Summer 2009 Table 4 — Ounces of Peters Professional® Conifer Grower (20-7-19) to add to 1 gallon of water to produce stock solutions with the following nitrogen concentrations (modified from Scotts Company 2004) Nitrogen (ppm) Nutrient Injector Ratios EC (mS/cm) 1:15 1:100 1:200 25 0.30 1.69 3.38 0.15 50 0.50 3.38 6.75 0.30 75 0.80 5.06 10.13 0.45 100 1.00 6.75 13.50 0.60 150 1.50 10.13 20.25 0.90 200 2.00 13.50 27.00 1.20 300 3.00 20.25 40.50 1.80 If this is all a bit intimidating, horticulture suppliers like Scotts® employ technical specialists who can help with the calculations, and have valuable information on their websites, for example: http://www.petersabc.com/. Stock solution 2 (SS#2) contains all mineral nutrients except Ca and S. An example of the computations for this stock solution is provided in Table 5. The upper portion shows the target nutrient concentrations in parts per million, the amount of each nutrient in the irrigation Developing a custom fertigation program — Custom water, and the amount needed to be added as fertilizer. fertilizer mixes utilize bulk chemicals to supply all the The chemicals used to supply nutrients and their contrimineral nutrients necessary for plant growth. Several bution in parts per million are shown in the left column. grades of commercial chemicals are classified according The final column on the right shows the total amount of to use, but technical or purified grades are best for cus- the chemical that would be present in the applied fertiltom fertilizer mixes in terms of purity and cost. Fertilizer solution. izer grade chemicals are formulated for bareroot applications and are not recommended for soluble fertilizer The total parts per million of each nutrient must be conmixes because they contain high percentages of impuri- verted to the weight of the chemical that needs to be ties. A list of commonly-used chemicals can be found added to each liter of water. This conversion is simple in Table 4.1.9 of Volume Four of the Container Tree because 1 liter of water weighs 1 kg by definition. Nursery Manual (Landis and others 1989). As menTherefore, on a weight per volume basis, 1 mg/l = 1 tioned in the first section, 2 stock solutions are typically ppm. A list of mineral nutrients are supplied by each used to prevent formation of insoluble precipitates. compound is given in Table 4.1.23 of Volume Four of the Container Tree Nursery Manual (Landis and others Stock solution 1 (SS#1) contains the acid to lower the 1989). Using magnesium sulfate (MgSO4) as an examwater pH and Ca and S if they are needed. The calcula- ple, this chemical contains 10% Mg and 13% S and the tions for how much acid to add consist of expanding the calculation in Table 5 shows that we need 38 ppm of Mg. So, how much MgSO4 do we need? ml per liter of water obtained in the titration (Figure 2) to the quantity of water in the stock tank. The accuracy 38 mg/l Mg = 380 mg/l of these computations should be checked by collecting 0.10 some of the applied irrigation water and testing its pH. Due to changes in irrigation water quality over the season and the effect of other chemicals in the applied ferti- To compute how much sulfur this would contribute: gation solution, the amount of acid added to the stock 380 mg/l x 0.13 = 49 ppm S solution may have to be adjusted occasionally. See Volume Four of the Container Tree Nursery Manual (Landis The recipe for all the ingredients is given in the "applied and others 1989) for more details. solution" column in Table 5 — this is the actual concentration of fertilizer that is applied to the seedlings. These values are carried down to the "applied solution" column 10 Forest Nursery Notes Summer 2009 11 Forest Nursery Notes Summer 2009 at the bottom of the table, where the conversions are made for the nutrient injector and the volume of concentrated stock solution. The adjustment for the nutrient injector (1:200) consists of multiplying the applied solution values by 200 and then converting milligrams to grams. Continuing with our example for MgSO4: water plus what was added in the fertigation stock solutions. Comparing these values with the targets shows that our calculations were reasonably close. The applied values are the final check on the fertigation programs and should be retested each season to make certain that everything is working properly. 380 mg/l x 200 = 76,000 mg/l = 76 g/l Part 2 of this article will be in the Winter 2010 issue and will cover Types of Injectors, When to Fertigate, and How to Monitor Fertigation. To compute how much bulk chemical is needed for the 200-liter concentrated stock solution tank, multiply by 200 and convert to kilograms: Sources 76 g/l x 200 = 15,200 g = 15.2 kg While custom fertilizer calculations may seem complicated at first, using a computer spreadsheet program can make calculations quicker, easier, and changeable over time (for example, changes in growth phases or additions of new fertilizers). A well-built spreadsheet can calculate target applied solutions with adjustments for water tests, injector ratios, stock solution volumes, and use of multiple fertilizer types — all you have to do is select your target nutrient concentrations! Start simple by using spreadsheet calculation functions to determine nutrient concentrations for the chemical fertilizers you use. To do this, select a primary nutrient for each of your fertilizer chemicals (for example, ammonium-N in Peters Professional Conifer Grower 20-7-19). The primary nutrient will be a changeable reference cell containing the target concentration of your choice. For each of the other nutrients in the fertilizer (for example, nitrate-N, Urea, P, K, Mg, Fe, Mn, Mo, Zn, Cu, and B in Peters Professional Conifer Grower), write formulas that calculate concentrations using the primary nutrient reference cell. So, for any selected change in ammonium-N concentration, the applied solution amount and all other nutrient concentrations would be automatically calculated for you. Set up the spreadsheet to sum nutrient concentrations for all fertilizer types used so you can compare them to target levels. Make concentration adjustments to your primary nutrient cells to closely balance and match your target levels. The resultant applied solution calculations can be multiplied by injector ratios and stock solution volumes for your final recipe; don’t forget to separate incompatible fertilizers into their own stock solutions. Remember, the true test of the fertigation calculations is to collect a sample of the applied fertigation solution and have it chemically analyzed. Table 6 shows the total fertigation program for the Mt. Sopris Nursery for pH, EC, and all the mineral nutrients. The values in the applied solution reflect the base levels in the irrigation Hoagland DR, Arnon DI. 1950. The water-culture method for growing plants without substrate. California Agricultural Experiment Station Circular 347. 32 p. Landis TD. 1997. The nutrient value of irrigation water. Portland (OR): USDA Forest Service, Cooperative Forestry. Forest Nursery Notes — January 1997. Landis TD, Tinus RW, McDonald SE, Barnett JP. 1989. Seedling nutrition and irrigation, vol. 4. The Container Tree Nursery Manual. Washington (DC): USDA Forest Service, Agriculture Handbook 674. 119 p. Landis TD, Tinus RW, Barnett JP. 1999. Seedling propagation, vol. 6. The Container Tree Nursery Manual. Washington (DC): USDA Forest Service Agriculture Handbook 674. 167 p. Nelson PV. 1978. Greenhouse operation and management. Reston (VA): Prentice-Hall Inc. 518 p. Scotts Company. 2004. Peters Professional ® 20-7-19 Conifer Grower, Tech Sheet H4062. Website: http:// www.scottspro.com/_documents/WSF/ PetersProfessional/H4062.pdf (accessed: 22 Jul 2008). Triebwasser ME. 2004. Fertilizer application: balancing precision, efficacy, and cost. In: Riley LE, Dumroese RK, Landis TD, technical coordinators. National proceedings: Forest and Conservation Nursery Associations—2003. Fort Collins (CO): USDA Forest Service, Rocky Mountain Research Station. Proceedings RMRSP-33: 38-41. Triebwasser MT, Altsuler SL. 1995. Fertilization practices and application procedures at Weyerhaeuser. In: Landis TD, Cregg B, technical coordinators. National Proceedings: Forest and Conservation Nursery Associations. Portland (OR): USDA Forest Service, Pacific Northwest Research Station. General Technical Report GTR-365: 84-88. 12 Forest Nursery Notes Summer 2009 Table 6 — Custom fertigation program used at Mt. Sopris Nursery, Carbondale, CO Units Irrigation Water Applied Fertigation Solution Target Water Quality Indices pH log units 6.9 6.0 5.5 Electrical conductivity mcS/cm 470 1,680 1,200 to 1,800 Macronutrients Nitrate Nitrogen ppm 3 170 156 Ammonium Nitrogen ppm 0 11 66 Total Nitrogen ppm 3 181 222 Phosphorus ppm 0 54 60 Potassium ppm 2 140 155 Calcium ppm 82 80 60 Magnesium ppm 14 48 40 Sulfate Sulfur ppm 43 135 63 Micronutrients Iron ppm 0.02 2.60 4.00 Manganese ppm 0.01 1.1 0.50 Copper ppm 0.01 0.07 0.02 Zinc ppm 0.01 0.07 0.05 Molybdenum ppm 0.10 0.10 0.01 Boron ppm 0.06 0.14 0.50 Chlorine ppm 3.00 4.00 4.00 13

