Exam 2 Solutions Math 5110/6830
Exam 2 Solutions
Math 5110/6830
1.
(a) 0 ≤ P ≤ 1
(b) h − P is the proportion of habitable but unpopulated patches.
(c) P ( ch − cP − µ ) = 0, i.e.
P
∗
1
= 0, P
∗
2
= h −
µ c
.
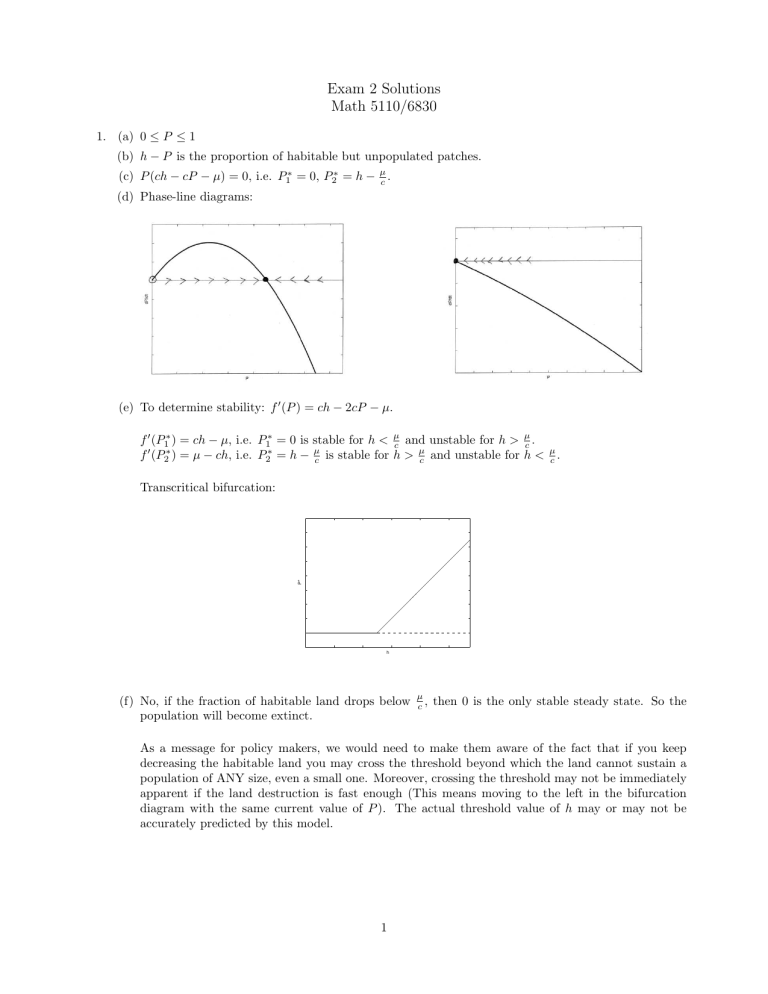
(d) Phase-line diagrams:
(e) To determine stability: f
0
( P ) = ch − 2 cP − µ .
f
0 f 0
( P
( P
∗
1
∗
2
) = ch − µ , i.e.
P
) = µ − ch , i.e.
P
1
∗
2
∗
= 0 is stable for
= h −
µ c h <
µ c is stable for h > and unstable for
µ h >
µ c
.
and unstable for h < c
µ
.
c
Transcritical bifurcation: h
(f) No, if the fraction of habitable land drops below population will become extinct.
µ c
, then 0 is the only stable steady state. So the
As a message for policy makers, we would need to make them aware of the fact that if you keep decreasing the habitable land you may cross the threshold beyond which the land cannot sustain a population of ANY size, even a small one. Moreover, crossing the threshold may not be immediately apparent if the land destruction is fast enough (This means moving to the left in the bifurcation diagram with the same current value of P ). The actual threshold value of h may or may not be accurately predicted by this model.
1
2.
(a) αn is the reproduction of the population
βn is the death process in the population
Kyn is the death in the population as a result of interaction with toxins
γn is the production of the toxin by the population
δy is the decay of the toxin
(b) n y
-nullcline:
-nullcline: n y
= 0 and
=
γn
δ y =
α − β
K
(c) Steady states are the intersections of the n nullcline and the y -nullcline (there are two, see above graph). They are ( n ∗ , y ∗ ): (0 , 0) and
δ ( α − β )
,
γK
α − β
K
.
(d) When y is large and n is small both derivatives are negative. The rest of arrows are determined by the nullcline crossings (see above graph).
(e)
J ( n
∗
, y
∗
) =
α − β − Ky
∗
γ
− Kn
∗
− δ
At (0 , 0):
J (0 , 0) =
α − β 0
γ − δ
Eigenvalues:
λ
1
λ
2
= α − β
= − δ < 0
If α > β the point is a saddle, and if α < β it’s a stable node.
At
δ ( α − β )
,
γK
α − β
K
:
J
δ ( α − β )
,
γK
α − β
K
=
0 − δ
γ
γ
( α − β )
− δ
Eigenvalues:
λ
1 , 2
=
− δ ± p
δ 2 − 4 δ ( α − β )
.
2
2
So, if δ < 4( α − β ), evals are complex with negative real part and the steady state is a stable spiral.
If δ > 4( α − β ) and α > β , both eigenvalues are real and negative so the steady state is a stable node.
However, if α < β , one of the eigenvalues is positive and the steady state is a saddle.
(f) Trajectory in phase-plane:
(g) Solution trajectories (for the case when there are stable oscillations): t t
Biologically it means that there will be oscillations in both the size of the population and the amount of toxins before both settle to a steady level. It can be explained in the following way: when the population increases, it starts producing more toxins, which, after a while starts killing the population.
When n is decreasing, there is less toxin produced and the population can start increasing again.
(h) When δ is large, it means that y is very fast. If we are interested in what happen on a longer time scale, we can consider that
0 ≈
1
δ
˙ =
γ
δ n − y.
In other words y will follow the dynamics of n and the system is reduced to
˙ = αn − βn − K
γ
δ
γ y = n.
δ n
2
,
3
3.
(a)
˙ = − k
1 ax + k
− 1 b
2
, b
˙
= 2 k
1 ax − 2 k
− 1 b
2
˙ = − k
1 ax + k
− 1 b
2
− 2 k
2 b
2
+ 2 k
− 2
+ k
2 b
2
− k
− 2 cx, cx, c ˙ = k
2 b
2 − k
− 2 cx.
Parameters k
1
, k
− 1
, k
2
, k
− 2 are the rates of corresponding reactions.
(b) 2X+B=const
4.
(a) m fast means that τ m is small. Therefore, the equation for m can be reduced to m = m
∞
( V ).
Graphically it means that any trajectory will quickly travel (near vertically) to the m nullcline and then travel along it to the steady state.
(b) No, this is not an excitable system (with these parameter values), because no perturbation results in a drastic excursion of the corresponding solution
4
