Math 4600, Homework 10
advertisement
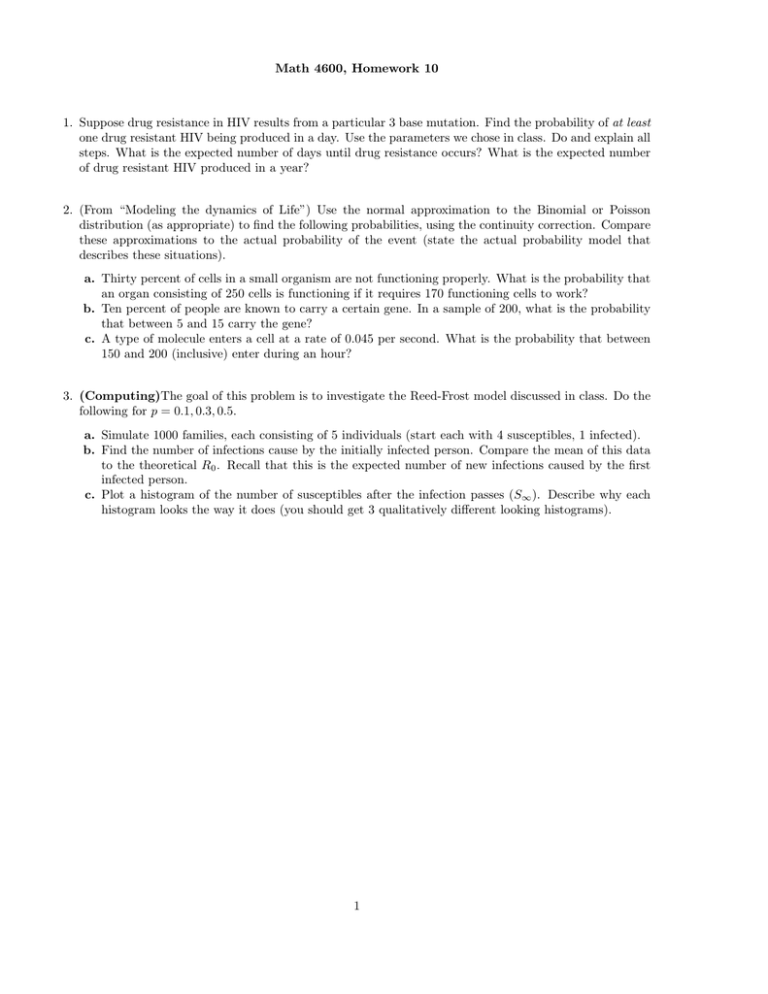
Math 4600, Homework 10 1. Suppose drug resistance in HIV results from a particular 3 base mutation. Find the probability of at least one drug resistant HIV being produced in a day. Use the parameters we chose in class. Do and explain all steps. What is the expected number of days until drug resistance occurs? What is the expected number of drug resistant HIV produced in a year? 2. (From “Modeling the dynamics of Life”) Use the normal approximation to the Binomial or Poisson distribution (as appropriate) to find the following probabilities, using the continuity correction. Compare these approximations to the actual probability of the event (state the actual probability model that describes these situations). a. Thirty percent of cells in a small organism are not functioning properly. What is the probability that an organ consisting of 250 cells is functioning if it requires 170 functioning cells to work? b. Ten percent of people are known to carry a certain gene. In a sample of 200, what is the probability that between 5 and 15 carry the gene? c. A type of molecule enters a cell at a rate of 0.045 per second. What is the probability that between 150 and 200 (inclusive) enter during an hour? 3. (Computing)The goal of this problem is to investigate the Reed-Frost model discussed in class. Do the following for p = 0.1, 0.3, 0.5. a. Simulate 1000 families, each consisting of 5 individuals (start each with 4 susceptibles, 1 infected). b. Find the number of infections cause by the initially infected person. Compare the mean of this data to the theoretical R0 . Recall that this is the expected number of new infections caused by the first infected person. c. Plot a histogram of the number of susceptibles after the infection passes (S∞ ). Describe why each histogram looks the way it does (you should get 3 qualitatively different looking histograms). 1
