Math 4600, Homework 7
advertisement
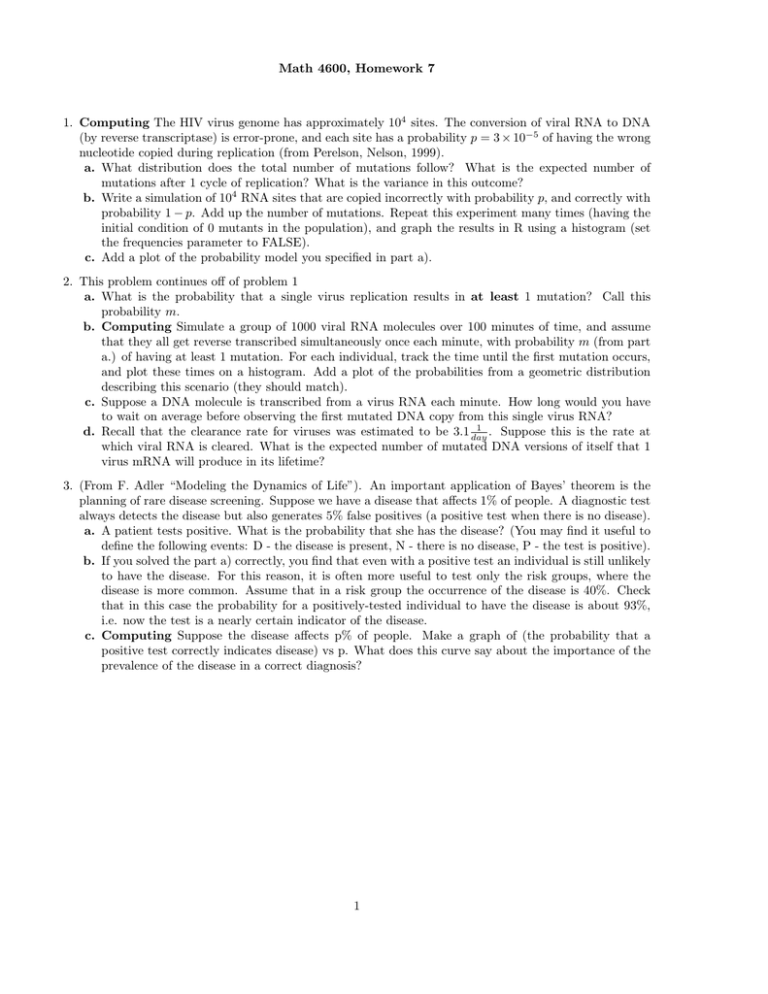
Math 4600, Homework 7 1. Computing The HIV virus genome has approximately 104 sites. The conversion of viral RNA to DNA (by reverse transcriptase) is error-prone, and each site has a probability p = 3 × 10⁻⁵ of having the wrong nucleotide copied during replication (from Perelson, Nelson, 1999). a. What distribution does the total number of mutations follow? What is the expected number of mutations after 1 cycle of replication? What is the variance in this outcome? b. Write a simulation of 104 RNA sites that are copied incorrectly with probability p, and correctly with probability 1 − p. Add up the number of mutations. Repeat this experiment many times (having the initial condition of 0 mutants in the population), and graph the results in R using a histogram (set the frequencies parameter to FALSE). c. Add a plot of the probability model you specified in part a). 2. This problem continues off of problem 1 a. What is the probability that a single virus replication results in at least 1 mutation? Call this probability m. b. Computing Simulate a group of 1000 viral RNA molecules over 100 minutes of time, and assume that they all get reverse transcribed simultaneously once each minute, with probability m (from part a.) of having at least 1 mutation. For each individual, track the time until the first mutation occurs, and plot these times on a histogram. Add a plot of the probabilities from a geometric distribution describing this scenario (they should match). c. Suppose a DNA molecule is transcribed from a virus RNA each minute. How long would you have to wait on average before observing the first mutated DNA copy from this single virus RNA? 1 . Suppose this is the rate at d. Recall that the clearance rate for viruses was estimated to be 3.1 day which viral RNA is cleared. What is the expected number of mutated DNA versions of itself that 1 virus mRNA will produce in its lifetime? 3. (From F. Adler “Modeling the Dynamics of Life”). An important application of Bayes’ theorem is the planning of rare disease screening. Suppose we have a disease that affects 1% of people. A diagnostic test always detects the disease but also generates 5% false positives (a positive test when there is no disease). a. A patient tests positive. What is the probability that she has the disease? (You may find it useful to define the following events: D - the disease is present, N - there is no disease, P - the test is positive). b. If you solved the part a) correctly, you find that even with a positive test an individual is still unlikely to have the disease. For this reason, it is often more useful to test only the risk groups, where the disease is more common. Assume that in a risk group the occurrence of the disease is 40%. Check that in this case the probability for a positively-tested individual to have the disease is about 93%, i.e. now the test is a nearly certain indicator of the disease. c. Computing Suppose the disease affects p% of people. Make a graph of (the probability that a positive test correctly indicates disease) vs p. What does this curve say about the importance of the prevalence of the disease in a correct diagnosis? 1
