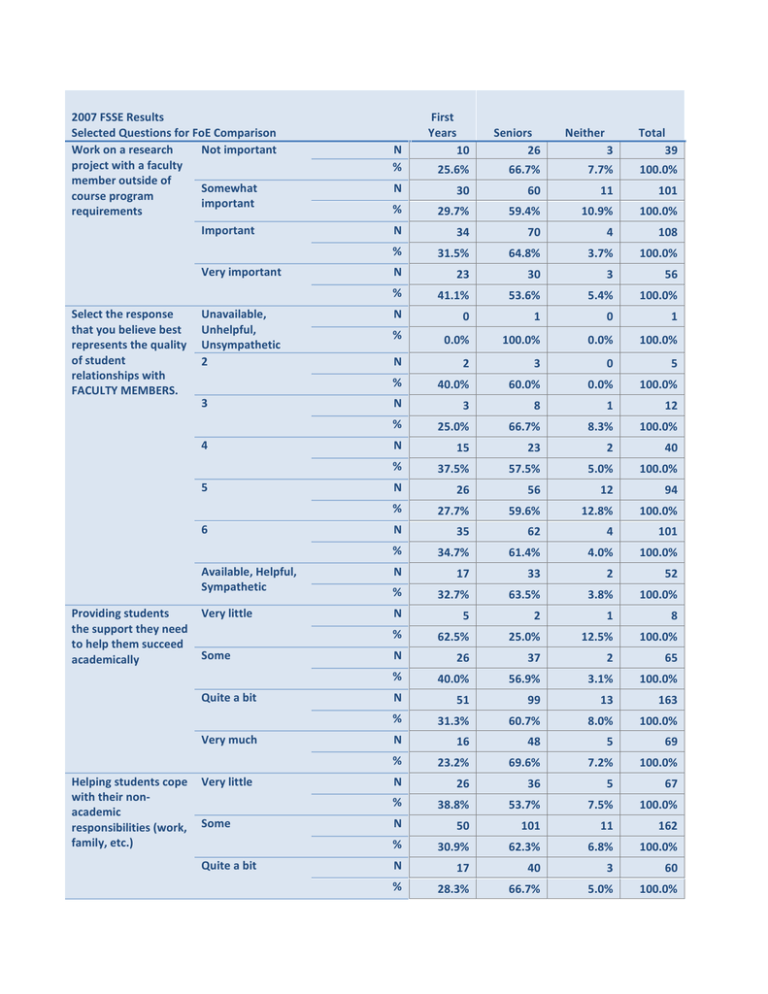
2007 FSSE Results First Selected Questions for FoE Comparison
advertisement

2007 FSSE Results Selected Questions for FoE Comparison Work on a research Not important project with a faculty member outside of Somewhat course program important requirements Important Very important Select the response that you believe best represents the quality of student relationships with FACULTY MEMBERS. Unavailable, Unhelpful, Unsympathetic 2 3 4 5 6 Providing students the support they need to help them succeed academically Seniors 26 25.6% N 3 Total 39 66.7% 7.7% 100.0% 30 60 11 101 % 29.7% 59.4% 10.9% 100.0% N 34 70 4 108 % 31.5% 64.8% 3.7% 100.0% N 23 30 3 56 % 41.1% 53.6% 5.4% 100.0% N 0 1 0 1 % 0.0% 100.0% 0.0% 100.0% N 2 3 0 5 % 40.0% 60.0% 0.0% 100.0% N 3 8 1 12 % 25.0% 66.7% 8.3% 100.0% N 15 23 2 40 % 37.5% 57.5% 5.0% 100.0% N 26 56 12 94 % 27.7% 59.6% 12.8% 100.0% N 35 62 4 101 % 34.7% 61.4% 4.0% 100.0% N % Neither Available, Helpful, Sympathetic N 17 33 2 52 % 32.7% 63.5% 3.8% 100.0% Very little N 5 2 1 8 % 62.5% 25.0% 12.5% 100.0% N 26 37 2 65 % 40.0% 56.9% 3.1% 100.0% N 51 99 13 163 % 31.3% 60.7% 8.0% 100.0% N 16 48 5 69 % 23.2% 69.6% 7.2% 100.0% N 26 36 5 67 % 38.8% 53.7% 7.5% 100.0% N 50 101 11 162 % 30.9% 62.3% 6.8% 100.0% N 17 40 3 60 % 28.3% 66.7% 5.0% 100.0% Some Quite a bit Very much Helping students cope with their nonacademic responsibilities (work, family, etc.) First Years 10 Very little Some Quite a bit Very much Providing students the support they need to thrive socially Very little Some Quite a bit Very much Encouraging students to participate in cocurricular activities (organizations, campus publications, student government, social fraternity or sorority, intercollegiate or intramural sports, etc.) Encouraging students to attend campus events and activities (special speakers, cultural performances, athletic events, etc.) Very little Some Quite a bit Very much Very little Some Quite a bit Very much Teaching undergraduate students in class 1-4 5-8 9-12 13-16 17-20 21-30 First Years Seniors Neither Total N 4 8 2 14 % 28.6% 57.1% 14.3% 100.0% N 15 20 6 41 % 36.6% 48.8% 14.6% 100.0% N 49 94 9 152 % 32.2% 61.8% 5.9% 100.0% N 26 58 5 89 % 29.2% 65.2% 5.6% 100.0% N 8 11 1 20 % 40.0% 55.0% 5.0% 100.0% N 6 10 3 19 % 31.6% 52.6% 15.8% 100.0% N 44 69 10 123 % 35.8% 56.1% 8.1% 100.0% N 38 74 6 118 % 32.2% 62.7% 5.1% 100.0% N 10 29 2 41 % 24.4% 70.7% 4.9% 100.0% N 13 15 1 29 % 44.8% 51.7% 3.4% 100.0% N 43 68 8 119 % 36.1% 57.1% 6.7% 100.0% N 28 77 9 114 % 24.6% 67.5% 7.9% 100.0% N 14 26 3 43 % 32.6% 60.5% 7.0% 100.0% N 9 20 2 31 % 29.0% 64.5% 6.5% 100.0% N 18 51 10 79 % 22.8% 64.6% 12.7% 100.0% N 55 95 8 158 % 34.8% 60.1% 5.1% 100.0% N 9 9 0 18 % 50.0% 50.0% 0.0% 100.0% N 3 10 0 13 % 23.1% 76.9% 0.0% 100.0% N 4 0 1 5 More than 30 Reflecting on ways to improve my teaching 0 1-4 5-8 9-12 13-16 17-20 More than 30 Working with undergraduates on research 0 1-4 5-8 9-12 13-16 17-20 21-30 More than 30 Advising undergraduate students 0 1-4 First Years Seniors Neither Total % 80.0% 0.0% 20.0% 100.0% N 0 1 0 1 % 0.0% 100.0% 0.0% 100.0% N 2 3 0 5 % 40.0% 60.0% 0.0% 100.0% N 73 134 14 221 % 33.0% 60.6% 6.3% 100.0% N 15 32 1 48 % 31.3% 66.7% 2.1% 100.0% N 6 8 2 16 % 37.5% 50.0% 12.5% 100.0% N 0 6 2 8 % 0.0% 75.0% 25.0% 100.0% N 1 3 1 5 % 20.0% 60.0% 20.0% 100.0% N 1 0 1 2 % 50.0% 0.0% 50.0% 100.0% N 33 71 12 116 % 28.4% 61.2% 10.3% 100.0% N 46 79 6 131 % 35.1% 60.3% 4.6% 100.0% N 13 20 1 34 % 38.2% 58.8% 2.9% 100.0% N 2 11 0 13 % 15.4% 84.6% 0.0% 100.0% N 2 3 1 6 % 33.3% 50.0% 16.7% 100.0% N 1 2 0 3 % 33.3% 66.7% 0.0% 100.0% N 1 0 0 1 % 100.0% 0.0% 0.0% 100.0% N 0 0 1 1 % 0.0% 0.0% 100.0% 100.0% N 13 33 4 50 % 26.0% 66.0% 8.0% 100.0% N 63 118 11 192 % 32.8% 61.5% 5.7% 100.0% 5-8 9-12 13-16 17-20 More than 30 Working with students on activities other than coursework (committees, orientation, student life activities, etc.) 0 1-4 5-8 9-12 17-20 21-30 More than 30 Other interactions with students outside of the classroom 0 1-4 5-8 9-12 13-16 17-20 21-30 First Years Seniors Neither Total N 17 22 5 44 % 38.6% 50.0% 11.4% 100.0% N 3 10 1 14 % 21.4% 71.4% 7.1% 100.0% N 0 2 0 2 % 0.0% 100.0% 0.0% 100.0% N 1 1 0 2 % 50.0% 50.0% 0.0% 100.0% N 1 0 0 1 % 100.0% 0.0% 0.0% 100.0% N 29 57 9 95 % 30.5% 60.0% 9.5% 100.0% N 59 105 10 174 % 33.9% 60.3% 5.7% 100.0% N 7 15 0 22 % 31.8% 68.2% 0.0% 100.0% N 2 6 1 9 % 22.2% 66.7% 11.1% 100.0% N 0 0 1 1 % 0.0% 0.0% 100.0% 100.0% N 0 1 0 1 % 0.0% 100.0% 0.0% 100.0% N 1 1 0 2 % 50.0% 50.0% 0.0% 100.0% N 10 25 3 38 % 26.3% 65.8% 7.9% 100.0% N 62 126 12 200 % 31.0% 63.0% 6.0% 100.0% N 20 26 3 49 % 40.8% 53.1% 6.1% 100.0% N 3 4 0 7 % 42.9% 57.1% 0.0% 100.0% N 0 2 0 2 % 0.0% 100.0% 0.0% 100.0% N 0 1 0 1 % 0.0% 100.0% 0.0% 100.0% N 2 0 0 2 More than 30 Lecture 0% 1-9% 10-19% 20-29% 30-39% 40-49% 50-74% 75% or more Teacher-led discussion 0% 1-9% 10-19% 20-29% 30-39% 40-49% 50-74% 75% or more Teacher-student shared responsibility 0% First Years Seniors Neither Total % 100.0% 0.0% 0.0% 100.0% N 1 1 1 3 % 33.3% 33.3% 33.3% 100.0% N 4 5 0 9 % 44.4% 55.6% 0.0% 100.0% N 11 19 2 32 % 34.4% 59.4% 6.3% 100.0% N 7 30 2 39 % 17.9% 76.9% 5.1% 100.0% N 10 35 1 46 % 21.7% 76.1% 2.2% 100.0% N 11 19 3 33 % 33.3% 57.6% 9.1% 100.0% N 10 20 4 34 % 29.4% 58.8% 11.8% 100.0% N 26 32 5 63 % 41.3% 50.8% 7.9% 100.0% N 17 15 2 34 % 50.0% 44.1% 5.9% 100.0% N 2 7 0 9 % 22.2% 77.8% 0.0% 100.0% N 27 43 7 77 % 35.1% 55.8% 9.1% 100.0% N 24 47 3 74 % 32.4% 63.5% 4.1% 100.0% N 18 45 5 68 % 26.5% 66.2% 7.4% 100.0% N 11 15 3 29 % 37.9% 51.7% 10.3% 100.0% N 4 12 0 16 % 25.0% 75.0% 0.0% 100.0% N 7 8 3 18 % 38.9% 44.4% 16.7% 100.0% N 1 4 0 5 % 20.0% 80.0% 0.0% 100.0% N 34 47 6 87 % 39.1% 54.0% 6.9% 100.0% (seminar, discussion, etc.) 1-9% 10-19% 20-29% 30-39% 40-49% 50-74% 75% or more Student computer use 0% 1-9% 10-19% 20-29% 30-39% 40-49% 50-74% 75% or more Small group activities 0% 1-9% 10-19% 20-29% First Years Seniors Neither Total N 24 49 2 75 % 32.0% 65.3% 2.7% 100.0% N 11 35 3 49 % 22.4% 71.4% 6.1% 100.0% N 11 24 4 39 % 28.2% 61.5% 10.3% 100.0% N 9 8 0 17 % 52.9% 47.1% 0.0% 100.0% N 2 4 2 8 % 25.0% 50.0% 25.0% 100.0% N 2 5 0 7 % 28.6% 71.4% 0.0% 100.0% N 1 2 0 3 % 33.3% 66.7% 0.0% 100.0% N 54 104 10 168 % 32.1% 61.9% 6.0% 100.0% N 30 42 6 78 % 38.5% 53.8% 7.7% 100.0% N 7 16 2 25 % 28.0% 64.0% 8.0% 100.0% N 3 5 1 9 % 33.3% 55.6% 11.1% 100.0% N 0 2 0 2 % 0.0% 100.0% 0.0% 100.0% N 0 3 0 3 % 0.0% 100.0% 0.0% 100.0% N 0 2 0 2 % 0.0% 100.0% 0.0% 100.0% N 0 0 1 1 % 0.0% 0.0% 100.0% 100.0% N 27 36 4 67 % 40.3% 53.7% 6.0% 100.0% N 25 52 4 81 % 30.9% 64.2% 4.9% 100.0% N 19 45 5 69 % 27.5% 65.2% 7.2% 100.0% N 13 31 3 47 30-39% 40-49% 50-74% 75% or more Student presentations 0% 1-9% 10-19% 20-29% 30-39% 40-49% 50-74% In-class writing 0% 1-9% 10-19% 20-29% 30-39% 40-49% Testing and evaluation 0% First Years Seniors Neither Total % 27.7% 66.0% 6.4% 100.0% N 5 7 1 13 % 38.5% 53.8% 7.7% 100.0% N 6 4 1 11 % 54.5% 36.4% 9.1% 100.0% N 1 5 1 7 % 14.3% 71.4% 14.3% 100.0% N 0 1 0 1 % 0.0% 100.0% 0.0% 100.0% N 47 54 6 107 % 43.9% 50.5% 5.6% 100.0% N 29 63 7 99 % 29.3% 63.6% 7.1% 100.0% N 12 34 4 50 % 24.0% 68.0% 8.0% 100.0% N 4 13 1 18 % 22.2% 72.2% 5.6% 100.0% N 2 4 2 8 % 25.0% 50.0% 25.0% 100.0% N 1 1 0 2 % 50.0% 50.0% 0.0% 100.0% N 0 4 0 4 % 0.0% 100.0% 0.0% 100.0% N 45 90 11 146 % 30.8% 61.6% 7.5% 100.0% N 39 71 5 115 % 33.9% 61.7% 4.3% 100.0% N 7 10 3 20 % 35.0% 50.0% 15.0% 100.0% N 2 3 1 6 % 33.3% 50.0% 16.7% 100.0% N 2 1 0 3 % 66.7% 33.3% 0.0% 100.0% N 1 0 0 1 % 100.0% 0.0% 0.0% 100.0% N 8 12 2 22 % 36.4% 54.5% 9.1% 100.0% 1-9% 10-19% 20-29% 30-39% 40-49% 50-74% Performances in applied and fine arts (e.g., dance, drama, music) 0% 1-9% 10-19% 20-29% 30-39% 50-74% 75% or more Experiential (labs, field work, art exhibits, etc.) 0% 1-9% 10-19% 20-29% 30-39% 40-49% First Years Seniors Neither Total N 47 110 10 167 % 28.1% 65.9% 6.0% 100.0% N 28 45 6 79 % 35.4% 57.0% 7.6% 100.0% N 11 4 3 18 % 61.1% 22.2% 16.7% 100.0% N 3 3 0 6 % 50.0% 50.0% 0.0% 100.0% N 0 2 0 2 % 0.0% 100.0% 0.0% 100.0% N 0 1 0 1 % 0.0% 100.0% 0.0% 100.0% N 74 147 18 239 % 31.0% 61.5% 7.5% 100.0% N 8 7 1 16 % 50.0% 43.8% 6.3% 100.0% N 1 5 1 7 % 14.3% 71.4% 14.3% 100.0% N 4 1 0 5 % 80.0% 20.0% 0.0% 100.0% N 2 0 0 2 % 100.0% 0.0% 0.0% 100.0% N 2 3 0 5 % 40.0% 60.0% 0.0% 100.0% N 4 1 0 5 % 80.0% 20.0% 0.0% 100.0% N 56 82 14 152 % 36.8% 53.9% 9.2% 100.0% N 12 27 2 41 % 29.3% 65.9% 4.9% 100.0% N 6 23 2 31 % 19.4% 74.2% 6.5% 100.0% N 9 12 2 23 % 39.1% 52.2% 8.7% 100.0% N 2 9 1 12 % 16.7% 75.0% 8.3% 100.0% N 5 7 0 12 50-74% 75% or more Working effectively with others Very little Some Quite a bit Very much Learning effectively on his or her own Very little Some Quite a bit Very much Understanding himself or herself Very little Some Quite a bit Very much Understanding people of other racial and ethnic backgrounds Very little Some Quite a bit Very much First Years Seniors Neither Total % 41.7% 58.3% 0.0% 100.0% N 5 6 0 11 % 45.5% 54.5% 0.0% 100.0% N 1 4 0 5 % 20.0% 80.0% 0.0% 100.0% N 7 1 0 8 % 87.5% 12.5% 0.0% 100.0% N 46 53 7 106 % 43.4% 50.0% 6.6% 100.0% N 31 76 7 114 % 27.2% 66.7% 6.1% 100.0% N 5 39 3 47 % 10.6% 83.0% 6.4% 100.0% N 14 11 1 26 % 53.8% 42.3% 3.8% 100.0% N 45 66 5 116 % 38.8% 56.9% 4.3% 100.0% N 27 63 10 100 % 27.0% 63.0% 10.0% 100.0% N 4 29 1 34 % 11.8% 85.3% 2.9% 100.0% N 18 12 0 30 % 60.0% 40.0% 0.0% 100.0% N 45 72 9 126 % 35.7% 57.1% 7.1% 100.0% N 24 62 6 92 % 26.1% 67.4% 6.5% 100.0% N 2 19 2 23 % 8.7% 82.6% 8.7% 100.0% N 31 37 5 73 % 42.5% 50.7% 6.8% 100.0% N 46 90 9 145 % 31.7% 62.1% 6.2% 100.0% N 12 29 0 41 % 29.3% 70.7% 0.0% 100.0% N 0 7 3 10 % 0.0% 70.0% 30.0% 100.0% First Years Developing a personal code of values and ethics Very little Some Quite a bit Very much Seniors Neither Total N 31 23 3 57 % 54.4% 40.4% 5.3% 100.0% N 46 83 9 138 % 33.3% 60.1% 6.5% 100.0% N 10 44 4 58 % 17.2% 75.9% 6.9% 100.0% N 1 13 1 15 % 6.7% 86.7% 6.7% 100.0%


