Student Body Profile – Fall 2013 Enrollment – Headcount Undergraduate
advertisement
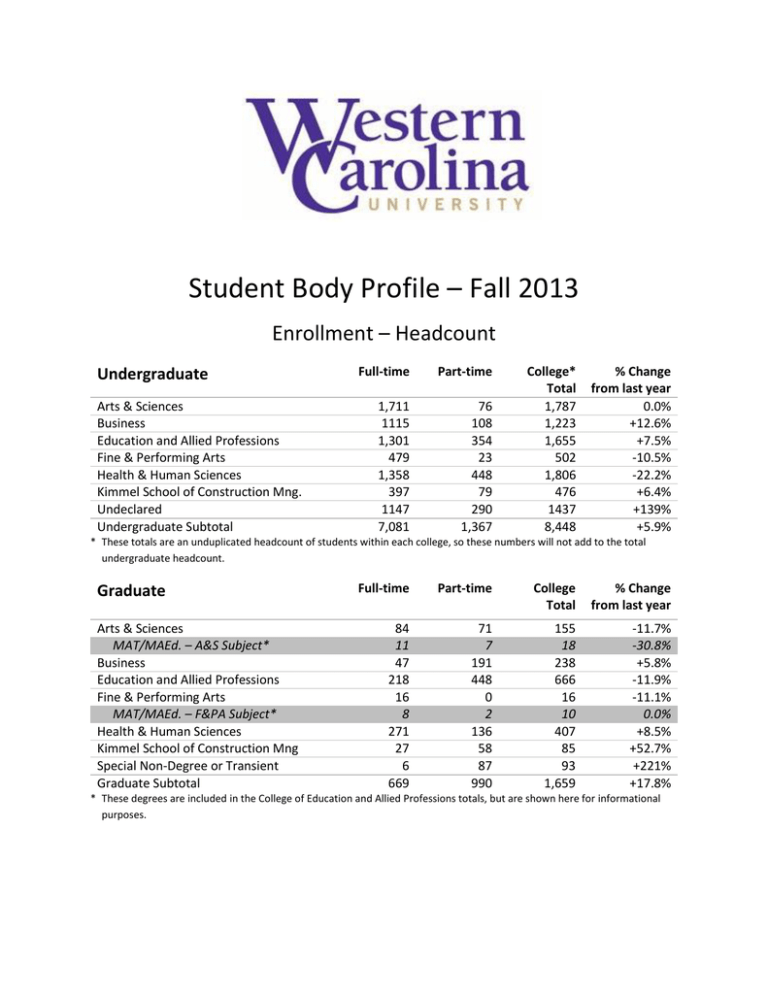
Student Body Profile – Fall 2013 Enrollment – Headcount Undergraduate Arts & Sciences Business Education and Allied Professions Fine & Performing Arts Health & Human Sciences Kimmel School of Construction Mng. Undeclared Undergraduate Subtotal Full-time Part-time 1,711 1115 1,301 479 1,358 397 1147 7,081 76 108 354 23 448 79 290 1,367 College* Total 1,787 1,223 1,655 502 1,806 476 1437 8,448 % Change from last year 0.0% +12.6% +7.5% -10.5% -22.2% +6.4% +139% +5.9% * These totals are an unduplicated headcount of students within each college, so these numbers will not add to the total undergraduate headcount. Graduate Arts & Sciences MAT/MAEd. – A&S Subject* Business Education and Allied Professions Fine & Performing Arts MAT/MAEd. – F&PA Subject* Health & Human Sciences Kimmel School of Construction Mng Special Non-Degree or Transient Graduate Subtotal Full-time Part-time College Total % Change from last year 84 11 47 218 16 8 271 27 6 669 71 7 191 448 0 2 136 58 87 990 155 18 238 666 16 10 407 85 93 1,659 -11.7% -30.8% +5.8% -11.9% -11.1% 0.0% +8.5% +52.7% +221% +17.8% * These degrees are included in the College of Education and Allied Professions totals, but are shown here for informational purposes. Credit Hours - Resident & Distance Resident 106,629 9,065 115,694 Undergraduate Graduate Total Distance 7,920 3,828 11,748 Level Total 114,549 12,893 127,433 % Change from last year +5.2% +3.4% +5.0% Gender Female 55% 66% 57% Undergraduate Graduate Overall Male 45% 34% 43% Race/Ethnicity Hispanic of any race American Indian or Alaskan Native Asian Black or African American Native Hawaiian or Other Pacific Islander White Multiple Race Unknown Total UG 361 2013 GR Total 48 409 % 4.0% 72 103 545 16 23 88 88 126 633 0.9% 1.2% 6.3% 8 6799 248 312 8448 1 1378 24 81 1659 9 8177 272 393 10107 0.0% 81.0% 2.7% 3.9% % 3.2% % Change In Racial Composition +3.5% 1.0% 1.1% 6.4% 0.0% +14.5% +3.4% 0.0% 82.9% 2.6% 3.9% 0% +2.6% +9.2% +44.6% 2012 Total 303 % 88 110 612 9 7966 249 271 9608 Citizenship US Citizen In-State Out-of-State Resident Aliens and Permanent Residents International (Non-resident aliens) Total Undergraduate 8173 7617 556 62 213 8448 Graduate 1568 1407 161 15 76 1658 Total 9741 9024 717 77 289 10,107 Undergraduate – Quality Indicators Average SAT Verbal . . . . . . . . . . . . . . . 511 Average SAT Math . . . . . . . . . . . . . . . . 518 Average SAT Combined . . . . . . . . . . . 1028 Average Composite ACT . . . . . . . . . . . …22 Average High School GPA . . . . . . . . . . 3.55 Average WCU GPA . . . . . . . . . . . . . . . . 3.05 Graduate - Quality Indicators Average GRE Verbal Reasoning . . . . . . . 152 Average GRE Quantitative Analysis . . . . 147 Average Composite GMAT . . . . . . . . . . . 493 Average Undergraduate GPA . . . . . . . . 3.36 Average WCU GPA . . . . . . . . . . . . . . . . . 3.76 Age Distribution Undergraduate 195 6628 926 475 214 10 0 8448 Less than 18 18-24 25-34 35-44 45-60 61 and over Unknown Total Graduate 0 348 722 376 204 9 0 1659 Youngest member of the student body: 15 years Oldest member of the student body: 71 years Student: Faculty Ratio 2013 2012 Ratio T.B.D. 15.10 to 1 Based on ratio will be posted when data is available 8088.33 student FTE and 535.67 faculty FTE Note: FTE (full-time equivalent) is based on the IPEDS definition, in use nationally, in which FTE is the full-time count plus 1/3 of the part-time count Total 195 6976 1648 851 418 19 0 10,107 Geographic Distribution of Students In State Total Enrollment 24 13 43 64 134 242 2 10 768 371 86 157 55 352 10 2 83 89 76 135 0 35 6 5 39 11 56 3 21 45 24 0 2 56 227 11 90 13 6 2 13 24 9 79 18 3 18 1 - 10 Students 11 - 25 Students 26 - 100 Students 101 - 999 Students 1,000+ Students 0 9 32 Total Enrollment 16 Counties of Western NC County Ashe Avery Buncombe Cherokee Clay Graham Haywood Henderson Jackson Macon Madison Mitchell Swain Transylvania Watauga Yancey Students 33 21 1070 158 56 49 360 371 768 225 43 13 129 86 24 20 0 23 33 89 221 4 1 15 18 538 8 23 501 83 11 2 9 24 121 170 245 5 56 156 49 225 7 360 129 158 58 208 212 87 1,070 34 37 206 36 39 67 21 20 15 5 4 33 28 1 14 Total Enrollment by State 1 0 9 0 8 0 3 0 18 4 4 1 2 3 0 6 15 2 0 1 9 10 1 0 1 5 4 1 1 23 18 41 25 4 5 9,114 26 1 6 111 0 1 161 1 8 3 10 52 2 2 © Daniel Dalet / d-maps.com Total Enrollment Top 10 States State North Carolina Georgia South Carolina Florida Virginia Tennessee Maryland New Jersey New York Ohio Students 9114 161 111 52 41 26 25 23 18 18 1 - 10 Students 11 - 25 Students 26 - 100 Students 101 - 999 Students 1,000+ Students International Total Enrollment 1 1 6 1 7 3 6 9,734 3 1 1 2 168 1 8 4 38 1 1 Unknowns Total Students 2 1 1 2 1 1 1 1 - 10 Students 11 - 25 Students 26 - 100 Students 101 - 999 Students 1,000+ Students 2 1 source: CIA World Fact Book (https://w w w .cia.gov/library/publications/the-w orld-factbook/index.html) 23 Foreign countries represented Total Enrollment Countries of Origin with 6 or More Students Country U.S.A. Jamaica Saudi Arabia Japan United Kingdom France Netherlands Students 9734 168 38 8 7 6 6
