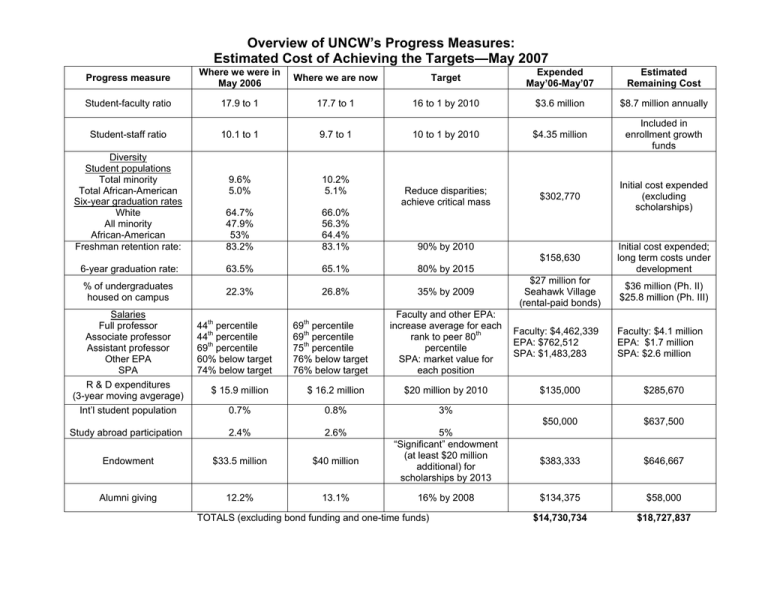
Overview of UNCW’s Progress Measures:
advertisement

Overview of UNCW’s Progress Measures: Estimated Cost of Achieving the Targets—May 2007 Progress measure Where we were in May 2006 Where we are now Target Expended May’06-May’07 Estimated Remaining Cost Student-faculty ratio 17.9 to 1 17.7 to 1 16 to 1 by 2010 $3.6 million $8.7 million annually Student-staff ratio 10.1 to 1 9.7 to 1 10 to 1 by 2010 $4.35 million Included in enrollment growth funds 9.6% 5.0% 10.2% 5.1% Reduce disparities; achieve critical mass $302,770 64.7% 47.9% 53% 83.2% 66.0% 56.3% 64.4% 83.1% Initial cost expended (excluding scholarships) $158,630 Initial cost expended; long term costs under development $27 million for Seahawk Village (rental-paid bonds) $36 million (Ph. II) $25.8 million (Ph. III) Diversity Student populations Total minority Total African-American Six-year graduation rates White All minority African-American Freshman retention rate: 90% by 2010 6-year graduation rate: 63.5% 65.1% 80% by 2015 % of undergraduates housed on campus 22.3% 26.8% 35% by 2009 Salaries Full professor Associate professor Assistant professor Other EPA SPA R & D expenditures (3-year moving avgerage) Int’l student population 44th percentile 44th percentile 69th percentile 60% below target 74% below target 69th percentile 69th percentile 75th percentile 76% below target 76% below target Faculty and other EPA: increase average for each rank to peer 80th percentile SPA: market value for each position $ 15.9 million $ 16.2 million $20 million by 2010 0.7% 0.8% 3% Study abroad participation 2.4% 2.6% Endowment $33.5 million $40 million 5% “Significant” endowment (at least $20 million additional) for scholarships by 2013 Alumni giving 12.2% 13.1% 16% by 2008 TOTALS (excluding bond funding and one-time funds) Faculty: $4,462,339 EPA: $762,512 SPA: $1,483,283 Faculty: $4.1 million EPA: $1.7 million SPA: $2.6 million $135,000 $285,670 $50,000 $637,500 $383,333 $646,667 $134,375 $58,000 $14,730,734 $18,727,837


