Recent advances in earthquake simulation in geotechnical engineering at Tsinghua University
advertisement
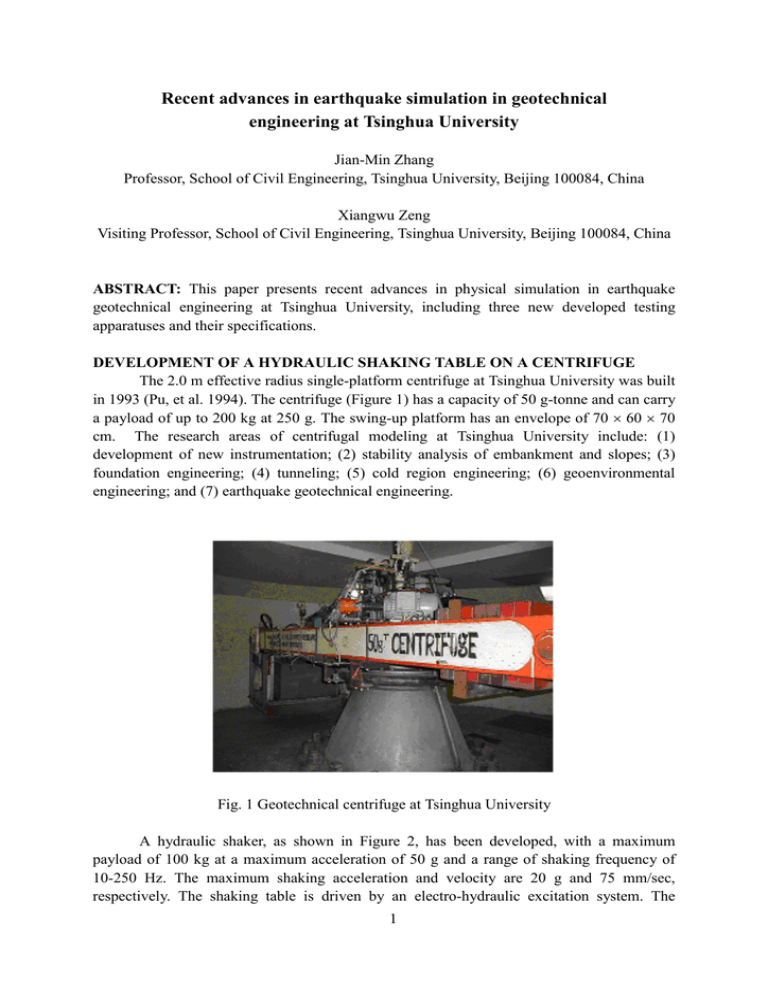
Recent advances in earthquake simulation in geotechnical engineering at Tsinghua University Jian-Min Zhang Professor, School of Civil Engineering, Tsinghua University, Beijing 100084, China Xiangwu Zeng Visiting Professor, School of Civil Engineering, Tsinghua University, Beijing 100084, China ABSTRACT: This paper presents recent advances in physical simulation in earthquake geotechnical engineering at Tsinghua University, including three new developed testing apparatuses and their specifications. DEVELOPMENT OF A HYDRAULIC SHAKING TABLE ON A CENTRIFUGE The 2.0 m effective radius single-platform centrifuge at Tsinghua University was built in 1993 (Pu, et al. 1994). The centrifuge (Figure 1) has a capacity of 50 g-tonne and can carry a payload of up to 200 kg at 250 g. The swing-up platform has an envelope of 70 × 60 × 70 cm. The research areas of centrifugal modeling at Tsinghua University include: (1) development of new instrumentation; (2) stability analysis of embankment and slopes; (3) foundation engineering; (4) tunneling; (5) cold region engineering; (6) geoenvironmental engineering; and (7) earthquake geotechnical engineering. Fig. 1 Geotechnical centrifuge at Tsinghua University A hydraulic shaker, as shown in Figure 2, has been developed, with a maximum payload of 100 kg at a maximum acceleration of 50 g and a range of shaking frequency of 10-250 Hz. The maximum shaking acceleration and velocity are 20 g and 75 mm/sec, respectively. The shaking table is driven by an electro-hydraulic excitation system. The 1 shaking table can simulate scaled earthquake records, which achieved by using a computer-controlled digital feedback correction system. Specifications of the shaking table are shown in Table 1. Table 1 Specifications of Tsinghua shaking table on centrifuge Radius of rotation Size of shaking table Centrifuge acceleration Maximum shaking acceleration Range of shaking frequency Shaking direction Excitation force Maximum payload 2.0 m 60 cm x 40 cm 50 g 20 g 10-250 Hz horizontal 30 kN 100 kg Figure 2 Photo of Tsinghua hydraulic shaker Data acquisition system was upgraded to meet the requirements of dynamic tests. The new system consists of transducers, a filter, and an A/D converter capable of recording 64 channels of data. The analog signals measured with transducers are amplified, filtered, and finally digitized in real time. The data are then sent through fiber optic rotary joint into a data acquisition computer and recorded. This system can record data with high precision by filtering out noise. Two laminar model containers were designed. They consist of rectangular frames made of square steel tubes. Linear bearings 2.5 mm high are installed between these frames. The inside dimensions of the two containers are 50 cm long, 20 cm wide, and 30 cm high and 30 cm × 30 cm × 50 cm, respectively. The containers are lined with 1 mm thick rubber membranes to provide waterproofing for saturated soil and to protect the bearings from the soil. The soil in the container can be saturated by supplying pore fluid through small holes in the base plate of the container under vacuum condition. In addition, an ESB model container with the inside dimensions of 50 cm in length, 20 cm in width, and 30 cm in height was designed and manufactured. A comparative study is being carried out to investigate the effect of model containers with the different dimensions and rigidity on the experimental results. 2 Dynamic centrifuge tests using this shaking table will be conducted to investigate the dynamic response of several Beijing subway stations under design, facilitate the understanding of dynamic soil-structure interaction, and assist the earthquake resistant design. In these tests, the effect of seismically-induced liquefaction of sandy soil layers on the dynamic performance of the subway stations will be investigated. DEVELOPMENT OF IN-FLIGHT PILE DRIVER / LOADING SYSTEM An in-flight pile installation and loading system was designed and made by Pan and Pu et al. (1998). The system is a robotic device consisting of a pile driver and a loading cell, both connected to two perpendicular guides denoted as X and Y. Figure 3 shows the device mounted on a model container. The pile driver can be positioned above a pile by horizontally moving the two guides. Therefore piles can be driven or pushed into ground in any sequence during the flight of the centrifuge. After the installation, the pile or pile group can be loaded by positioning the loading cell onto the piles without stopping the operation of the centrifuge. It is a light device so that can be easily mounted onto the model container or dismounted when necessary. Fig. 3 In-flight pile installation and loading device Centrifuge tests have been conducted to investigate the effect of driving sequence on bearing capacity of pile group in saturated clayey soil (Li, Zheng and Pu, 2001). A group of 9 piles in a square array was then driven into the clay one by one. The distance between two adjacent piles was 3 times the diameter. The pile cap was made of glass 2 cm thick. The pore pressure transducers were located at 14.1 m and 9.3 m depths (prototype scale), respectively. The first pile was driven in which took about 1 minute, and then the next pile was driven in after a minute. Attention was focused on the built-up, distribution and dissipation of pore water pressure during pile driving. Two typical kinds of driving sequence, from inside to outside or from outside to inside, were simulated using the in-flight pile installation and loading system. Figure 4a shows the arrangement of pore pressure transducers for the case of the piles driven from inside to outside. Figures 4b, 4c, 4d, and 4e show the pore pressure variations at points 3, 5, 6, and 8. It can be seen that the pore pressure variation when driving the first pile 3 was similar to that of the single pile. The increase due to driving the subsequent piles, however, was less than that due to the first pile, since it was a combination of effects. The excess pore pressure at point 8, which was located outside the pile group, is less than that of the inside location such as point 3. Point 6 was between the third pile and the fourth pile, as shown in the figure 4d, resulting in less pressure due to the fifth pile. This result indicated that the fourth pile shielded the fifth pile, leading to smaller compaction. At point 5, the pore pressure increase was greater as the piles were driven toward this location, and was less as the piles were driven away from it, which also verifies the shield effect. The data in Figure 4f show that the dissipation process and the stable value were consistent at the same depth. However, the dissipation with the pile group was faster than that with the single pile. Moreover, the relative portion of the load carried by the central pile was the smallest, with the largest portion carried by the corner piles. In addition, the pore water pressure generated during piles driven from inside to outside is less than that from outside to inside. It may be drawn that high excess pore pressures induced by driving piles can significantly lower the bearing capacity of pile group, and the effects of different pile-driving sequences should be properly considered in the evaluation of the capacity of pile group in clayey soil layers. (a) Transducers arrangement (d) Pore pressure variation (b) Pore pressure variation (e) Pore pressure variation (c) Pore pressure variation (f) Pore pressure dissipation Fig. 4 Centrifuge model test for driving group piles from outside to inside 4 DEVELOPMENT OF CYCLIC SHEAR APPARATUS FOR SOIL-STRUCTURE INTERFACE As shown in Fig. 5, a new test apparatus has been developed at Tsinghua University recently in order to investigate the monotonic and cyclic mechanical characteristics of interface between two materials or between soil and structure. The interface apparatus is referred to as “TH-20t CSASSI” (TsingHua 20 tonne Cyclic Shear Apparatus for Soil-Structure Interface) and its specifications are listed in Table 2. It is schematically illustrated in Fig. 6. The material of structural surface in conjunction with gravels in test may cover the common one in civil engineering such as concrete, steel, geotextile and geomembrane. Three normal loading conditions, including constant normal pressure, constant normal stiffness and constant volume, can be applied on the interface. The load applied on the interface and the displacement of the interface can be measured with high accuracy. The characteristics of interface under high stress conditions can be simulated. The deformation and failure of the soil near the interface can be observed and measured in both micro and macro way. The macro and micro measuring technologies as well as corresponding support software have been developed. Table 2 Specifications of TH-20t Cyclic Shear Apparatus for Soil-Structure Interface (TH-20t CSASSI) Interface Size (cm) Maximum Load (kN) Maximum displacement (cm) Long Wide Shear Normal Tangential 50 36 200 200 10 Accuracy of Maximum Normal Measurement Frequency 2.5 0.1% 0.1Hz Fig. 5 Photograph of TH-20t CSASSI 5 The new interface apparatus has several new features compared with other available interface testing devices such as: 1) Larger inside interface area of 500mm × 360 mm; 2) Monotonic loading at various loading rates; 3) Various boundary conditions normal to the interface plane such as constant normal pressure, constant normal stiffness and constant volume; 4) Various materials of structural surface in conjunction with soils such as concrete, steel, geotextile and geomembrane; Load Cell Normal Condition Cell Structure Frame Soil Container Data Acquisition Cell Fig. 6 Schematic view of TH-20t CSASSI 5) Coarse soils in conjunction with structural surface such as gravels; 6) Higher shear and normal loads up to 200 kN; 7) Observation and measurement of deformation and failure of the soil near the interface by both micro and macro ways. The control of TH-20t CSASSI and the data acquisition are fully automated by a computer- controlled system including transducers. Two independent hydraulic forces are applied to induce the normal and tangential stress components at the interface plane. Two 6 load cells and five LVDTs were employed to measure the loads and displacements in the two directions. Two types of soil containers, i.e., direct shear type and simple shear type, can be adopted with the new apparatus. A window of thick glass is set up near the interface plane on the one side frame of the container for observing the movement and crushing of soil particles as well as the formation of the shear band. The stiffness in the direction normal to the interface is defined as the ratio of the change in the normal stress σ n to the change in the normal displacement v at the upper boundary of soil sample. The stiffness is herein denoted as K and thus K = dσ n / dv . When K=0 K=∞ σ n=const Fixed boundary Structureee Structure Soil Structure Soil Soil a) Constant pressure K= const b) Constant volume c) Constant stiffness Fig. 7 Three boundary conditions in the normal direction the normal stiffness K takes constant, zero and infinity, three typical boundary conditions of constant normal stiffness, constant normal stress and constant volume can be realized in laboratory experiments, as shown in Figure 7. Three kinds of cyclic shear interface tests using a direct shear box have been done for the three normal boundary conditions. As a typical example, two test results are provided in Figures 8 and 9 which show the plots of tangential displacement-shear stress and tangential displacement-volumetric strain as well as volumetric strain-time history, respectively, for dense gravels under two different boundary conditions of constant pressure ( σ n = 100 kPa) and constant stiffness ( K = 40 kPa/mm). 100 Cycle1 Cycle10 Cycle70 80 Shear Stress• / kPa 60 40 20 0 -20 -40 -60 -80 -100 -60 -40 -20 0 20 40 T angential Displacement u / mm 60 (a) Tangential displacement-shear stress relation 7 Normal Displacement v / mm -4 -2 0 2 4 6 Cycle1 Cycle10 Cycle70 8 10 12 14 16 -60 -40 -20 0 20 40 T angential Displacement u / mm 60 (b) Tangential displacement-normal displacement relation Normal Displacement v / mm -4 0 4 8 12 16 0 5000 10000 15000 20000 T ime t / s (c) Time history of normal displacement Fig. 8 Cyclic tangential displacement controlled testing results under constant normal pressure (σ=100kPa) Normal Stress• / kPa 500 400 300 200 100 0 0 2000 4000 T ime t / s 6000 8000 (a) Time history of normal displacement 8 Normal Displacement v / mm 0 2 4 6 Cycle1 Cycle5 Cycle20 8 -60 -40 -20 0 20 40 T angential Displacement u / mm 60 (b) Tangential displacement-normal displacement relation 300 Shear Stress¦ Ó/ kPa 200 100 0 -100 -200 -300 0 100 200 300 400 Normal Stress¦ Ò/ kPa 500 (3) Normal stress-shear stress relation Fig. 9 Stress path in cyclic tangential displacement controlled testing under constant normal stiffness (k=40kPa/mm) Further research has been planned: 1) to investigate the cyclic behavior of soil-structure interface and particularly gravel-structure, 2) to study the cyclic behavior of interface between coarse soil and structure, 3) to examine the behavior of interface between coarse soil and geosythetics, 4) to build new cyclic interface constitutive model, particularly for gravels, and 5) to evaluate the loading-deformation and the stability of the soil-structure system. CONCLUSIONS The above mentioned work is a brief summary of recent advances in physical simulation in earthquake geotechnical engineering at Tsinghua University. Besides the physical simulation, a comprehensive series of theoretical and numerical analyses on the static and seismic response of high earth-rockfill dams and other geotechnical works have 9 also been carried out together with several major engineering projects in recent years. Three-dimensional finite element methods with non-linear elastic and elasto-plasticity models have been developed and applied to static and dynamic analysis of several high earth-rockfill dams in China. REFERENCES Chen, X, Pu, J. & Luo, X (2000). “Centrifugal modelling of foundation frost heave and thaw settlement.” Ground Freezing 2000, A.A. Balkema, Rotterdam, 2000, 115-118 Pan, S. S., Pu, J, Yin, K, and Liu, F. (1999). “Development of pile driver and load set for pile group in centrifuge.” Geotechnical Testing Journal, ASTM, 22(4): 917-923. Li, S, Zheng, J, and Pu, J (2001). “Effects of different driving sequences on capacity of pile group.” Proc. of the Fifteenth International Conference on Soil Mechanics and Geotechnical Engineering. Istanbul, A.A. Balkema, August 27-31, 2001. Pu, J, Liu, F, Li, J, Li, S, Yin, K, Sun, Y and Jin, P (1994). "Development of Medium-size Geotechnical Centrifuge at Tsinghua University." Proc. of Int. Conference Centrifuge 94, Singapore 31 Aug.-2 Sept., 1994, 53-56. 10


