Perfluorinated Compounds in Streams of the Shihwa Industrial Zone and Lake... South Korea C:\web sites\PDF_Test\pdf\2414.pdf
advertisement
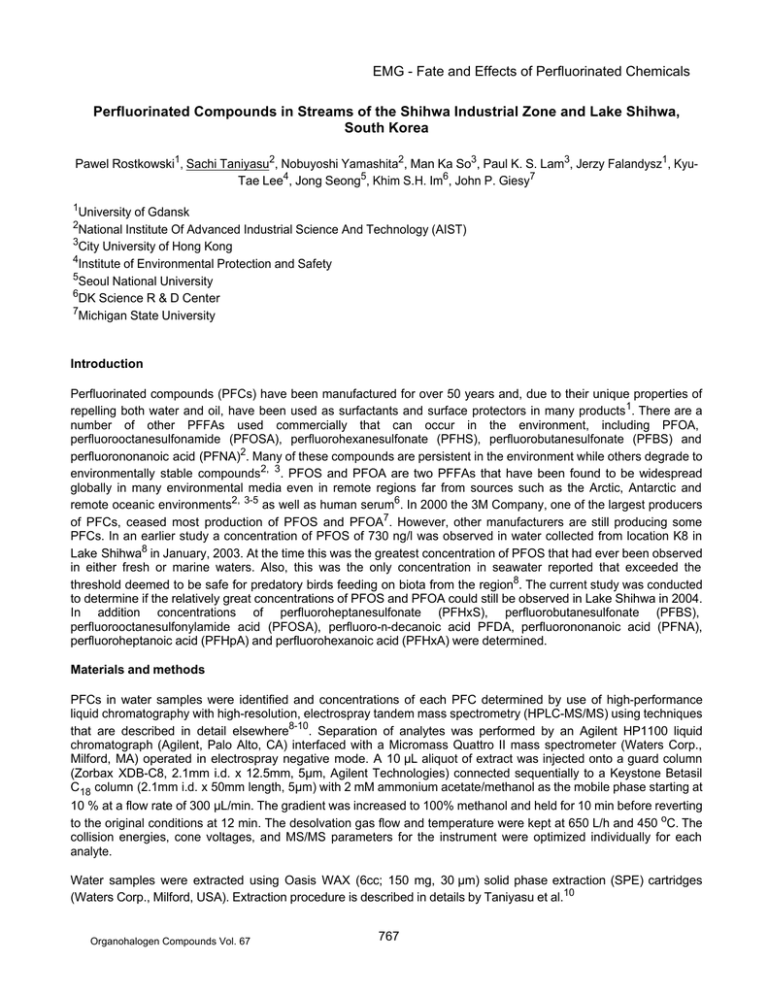
EMG - Fate and Effects of Perfluorinated Chemicals C:\web sites\PDF_Test\pdf\2414.pdf Perfluorinated Compounds in Streams of the Shihwa Industrial Zone and Lake Shihwa, South Korea Pawel Rostkowski1, Sachi Taniyasu2, Nobuyoshi Yamashita2, Man Ka So3, Paul K. S. Lam3, Jerzy Falandysz1, KyuTae Lee4, Jong Seong5, Khim S.H. Im6, John P. Giesy7 1 University of Gdansk National Institute Of Advanced Industrial Science And Technology (AIST) 3 City University of Hong Kong 4 Institute of Environmental Protection and Safety 5 Seoul National University 6 DK Science R & D Center 7 Michigan State University 2 Introduction Perfluorinated compounds (PFCs) have been manufactured for over 50 years and, due to their unique properties of repelling both water and oil, have been used as surfactants and surface protectors in many products 1. There are a number of other PFFAs used commercially that can occur in the environment, including PFOA, perfluorooctanesulfonamide (PFOSA), perfluorohexanesulfonate (PFHS), perfluorobutanesulfonate (PFBS) and perfluorononanoic acid (PFNA)2. Many of these compounds are persistent in the environment while others degrade to environmentally stable compounds2, 3. PFOS and PFOA are two PFFAs that have been found to be widespread globally in many environmental media even in remote regions far from sources such as the Arctic, Antarctic and remote oceanic environments2, 3-5 as well as human serum6. In 2000 the 3M Company, one of the largest producers of PFCs, ceased most production of PFOS and PFOA7. However, other manufacturers are still producing some PFCs. In an earlier study a concentration of PFOS of 730 ng/l was observed in water collected from location K8 in Lake Shihwa8 in January, 2003. At the time this was the greatest concentration of PFOS that had ever been observed in either fresh or marine waters. Also, this was the only concentration in seawater reported that exceeded the threshold deemed to be safe for predatory birds feeding on biota from the region8. The current study was conducted to determine if the relatively great concentrations of PFOS and PFOA could still be observed in Lake Shihwa in 2004. In addition concentrations of perfluoroheptanesulfonate (PFHxS), perfluorobutanesulfonate (PFBS), perfluorooctanesulfonylamide acid (PFOSA), perfluoro-n-decanoic acid PFDA, perfluorononanoic acid (PFNA), perfluoroheptanoic acid (PFHpA) and perfluorohexanoic acid (PFHxA) were determined. Materials and methods PFCs in water samples were identified and concentrations of each PFC determined by use of high-performance liquid chromatography with high-resolution, electrospray tandem mass spectrometry (HPLC-MS/MS) using techniques that are described in detail elsewhere8-10. Separation of analytes was performed by an Agilent HP1100 liquid chromatograph (Agilent, Palo Alto, CA) interfaced with a Micromass Quattro II mass spectrometer (Waters Corp., Milford, MA) operated in electrospray negative mode. A 10 µL aliquot of extract was injected onto a guard column (Zorbax XDB-C8, 2.1mm i.d. x 12.5mm, 5µm, Agilent Technologies) connected sequentially to a Keystone Betasil C18 column (2.1mm i.d. x 50mm length, 5µm) with 2 mM ammonium acetate/methanol as the mobile phase starting at 10 % at a flow rate of 300 µL/min. The gradient was increased to 100% methanol and held for 10 min before reverting to the original conditions at 12 min. The desolvation gas flow and temperature were kept at 650 L/h and 450 oC. The collision energies, cone voltages, and MS/MS parameters for the instrument were optimized individually for each analyte. Water samples were extracted using Oasis WAX (6cc; 150 mg, 30 µm) solid phase extraction (SPE) cartridges (Waters Corp., Milford, USA). Extraction procedure is described in details by Taniyasu et al.10 Organohalogen Compounds Vol. 67 767 EMG - Fate and Effects of Perfluorinated Chemicals To determine the precision and accuracy of the extraction and analytical procedures recovery and blank laboratory tests were performed. To determine the recovery of PFOS and other PFCs, 40 µL of PFCmix was spiked into 400mL of Milli-Q water samples and then extracted same procedures used for inland water samples. More over travel blank travel recovery samples and duplicated sample from location 12 and 31 were analyzed. Results of the blank and recovery tests are summarized in Table 1. Concentrations of all target analytes were quantified by using calibration curve constructed using external standards. The limit of quantification (LOQ) was determined for each analyte as the lowest concentration standard injected which could meet the acceptance criteria for particular run. LOQ were 0.5 ng/L for all target analytes. Table 1. Recoveries (%) and a level of blank (ng/L) for individual PFCs. Compound PFASs PFOS PFHxS PFBs PFOSA PFCAs PFDA PFNA PFOA PFHpA PFHxA Recovery [%] Blank Travel Travel No. samples Range Mean SD [ng/l] Blank A Recovery 4 4 4 4 88 - 94 80 - 105 80 - 92 88 - 139 91 92 87 112 3 11 5 24 <0.5 <0.5 <0.5 <0.5 <0.5 0.58 <0.5 <0.5 88 86 89 95 4 4 4 4 4 83 - 97 92 - 106 86 - 105 80 - 103 77 - 105 88 99 95 94 95 6 6 8 10 12 <0.5 <0.5 <0.5 <0.5 <0.5 <0.5 <0.5 <0.5 <0.5 <0.5 83 102 95 103 94 Organohalogen Compounds Vol. 67 768 EMG - Fate and Effects of Perfluorinated Chemicals Results and discussion Above PFCs were analyzed in 27 samples (Table 2). Duplicate samples (12 and 31) showed acceptable repeatability for most chemicals. Table 2. Concentrations of individual PFCs in each analyzed sample [ng/L] Sample Sample PFASs PFCAs location name PFOS PFHxS PFBS PFOSAPFDAPFNAPFOAPFHpAPFHxA 1 IL1 20 2.0 0.9 <0.5 1.0 1.2 7.3 0.9 0.8 2 IL2 48 4.3 1.6 2.4 6.0 4.8 20. 2.2 2.9 4 IL4 45 7.9 3.8 0.6 0.6 1.8 7.5 1.3 3.9 5 IL5 283. 18. 18 1.2 3.2 5.3 19. 3.6 11 7 IL7 21 2.9 1.6 <0.5 0.6 1.3 6.2 1.0 1.1 8 IL8 65 5.1 1.5 <0.5 2.3 5.6 21 2.2 2.0 9 IL9 46 5.0 1.3 0.6 2.4 4.2 13 2.2 2.6 10 IL10 651 85 24 1.7 2.4 7.0 62 7.1 27 12 IL12D 45 8.9 <0.5 0.6 <0.5 2.8 20 3.5 6.1 12 IL12 38 6.8 2.9 <0.5 1.1 2.0 20 2.9 4.1 13 IL13 47 5.2 1.2 <0.5 2.7 5.4 34 3.5 6.4 14 IL14 48 7.0 2.7 <0.5 0.9 2.8 20 2.6 3.5 15 IL15 61 8.9 2.4 0.8 1.5 3.7 21 3.2 5.1 16 IL16 59 7.5 <0.5 <0.5 2.3 3.9 29 2.4 2.5 18 IL18 8 2.2 0.6 <0.5 <0.5 1.4 12 1.3 1.2 20 IL20 10 3.2 0.8 <0.5 <0.5 0.8 5.2 1.1 1.3 21 IL21 17 1.9 0.6 0.6 0.7 1.7 9.4 1.4 1.6 22 LS8 18 2.0 1.0 <0.5 0.9 2.1 11 1.1 1.4 23 LS1 16 1.7 <0.5 <0.5 0.6 1.7 9.2 1.0 1.0 24 LS2 13 0.6 <0.5 <0.5 <0.5 1.3 4.5 <0.5 0.7 25 LS3 7.3 0.9 0.6 <0.5 <0.5 0.6 1.7 <0.5 <0.5 27 LS5 9.9 1.3 0.5 <0.5 <0.5 0.9 4.5 0.6 0.5 31 LS9 8.3 0.6 <0.5 <0.5 <0.5 0.8 3.3 <0.5 0.6 31 LS9 7.7 0.6 <0.5 <0.5 <0.5 0.7 3.2 0.5 0.5 32 LS10 5.3 1.0 <0.5 <0.5 <0.5 0.5 2.5 0.4 0.5 33 LS11 2.6 0.8 <0.5 <0.5 <0.5 <0.5 0.9 <0.5 <0.5 34 LS12 2.2 <0.5 2.5 <0.5 <0.5 <0.5 1.1 <0.5 <0.5 Obtained results showed that waters in Shihwa Industrial Zone in general are highly contaminated with variety of PFCs with PFOS, PFOA as a dominant. The concentrations of PFOS ranged from 2.2 – 651 ng/L. The highest concentrations were observed in location 10 (651 ng/L), 5 (283 ng/L) while concentrations of PFOA 62 ng/L and 19 ng/L, respectively. It suggests possible point sources of PFOS in these locations which are small channel with outlet to Lake Shihwa. The lowest concentration of PFOS was detected in water sample at location 34, located very far from sources mentioned before. PFOSA concentrations ranged from 0.6 – 2.4 ng/L. It was detected in locations 2,4,5,9,10,12,15,21 with the highest concentration in location 2. PFDA was detected in 90% of analyzed samples and ranged from 0.6 – 6.0 ng/L in location 2. References 1. OECD. Draft assessment of perfluorooctanesulfonate (PFOS) and its salts: Complete assessment; September 16, 2002. ENV/JM/RD(2002)17. 2. Giesy, J.P.; Kannan, K. Environ. Sci. Technol.2002, 36, 147A-152A. 3. Kissa, E. Fluorinated surfactants and repellents, 2nd ed.; Marcel Dekker: New York, 2001. Organohalogen Compounds Vol. 67 769 EMG - Fate and Effects of Perfluorinated Chemicals 4. Giesy, J.P.; Kannan, K. Environ. Sci.Technol. 2001, 35, 1339-1342. 5. Kannan, K.; Koistinen, J.; Beckmen, K.; Evans, T.; Gorzelany, J.F.; Hansen, K.J.; Jones, P.D.; Helle, E.; Nyman, M.; Giesy, J.P. Environ. Sci. Technol. 2001, 35, 1593-1598. 6. Olsen, G.W.; Burris, J.M.; Mandel, J.H.; Zobel, L.R. J. Occup. Environ. Med. 1999, 41, 799-806. 7. Martin, J.W., K. Kannan, U. Berger, P. DeVoogt, J. Fields, J. Franklin, J.P. Giesy, T. Harner, D. Muir, B. Scott, M. Kaiser, U. Järnberg, K.C. Jones, S.A. Mabury, H. Schroeder, M. Simcik C. Sottani, B. Van Bavel, A. Kärrman, G. Lindström and S. Van leeuwen. 2004. Analytical Challenges Hamper Perfluoroalkyl Research. Environ. Sci. Technol. 38:249A-255A. 8. So, M. K., S. Taniyasu, N. Yamashita, J. P. Giesy, J. Zheng, Z. Fang, S. H. Im and Paul K. S. Lam. 2004. Perfluorinated Compounds in Coastal Waters of Hong Kong, South China and Korea. Environ. Sci. Technol. 38:4056-4063. 9. Yamashita, N.; Kannan, K.; Taniyasu, S.; Horii, Y.; Okazawa, T.; Petrick, G.; Gamo, T. Environmental Science & Technology 2004, 38, 5522-5528. 10. Taniyasu, S.; Kannan, K.; So, M. K.; Gulkowska A.; Sinclair E.; Okazawa T. and N. Yamashita. A method for the analysis of Fluorotelomer Alcohols, Fluorotelomer Acids, and Short- and Long-Chain Perfluorinated Acids in Water and Biota. Journal of Chromatography A 2005 (in press). Organohalogen Compounds Vol. 67 770
