RGB and Structural Imaging PlantScreen Phenotyping Systems
advertisement

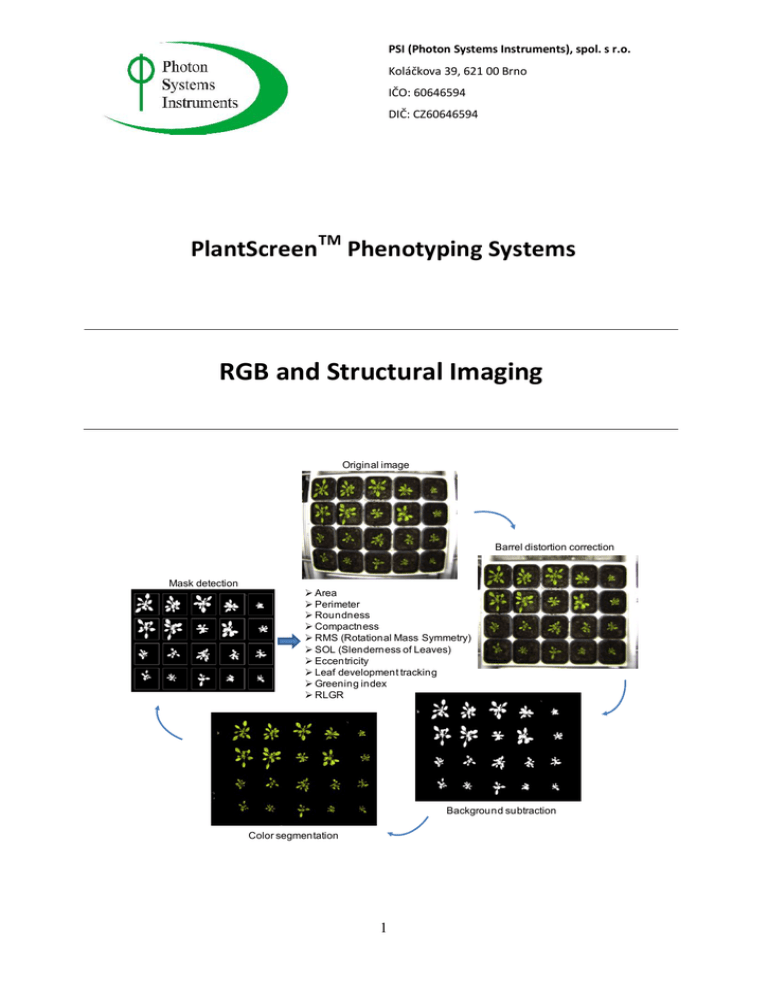
PSI (Photon Systems Instruments), spol. s r.o. Koláčkova 39, 621 00 Brno IČO: 60646594 DIČ: CZ60646594 PlantScreenTM Phenotyping Systems RGB and Structural Imaging Original image Barrel distortion correction Mask detection Area Perimeter Roundness Compactness RMS (Rotational Mass Symmetry) SOL (Slenderness of Leaves) Eccentricity Leaf development tracking Greening index RLGR Background subtraction Color segmentation 1 PSI (Photon Systems Instruments), spol. s r.o. Koláčkova 39, 621 00 Brno IČO: 60646594 DIČ: CZ60646594 Introduction A central feature of any phenomics screening system is the ability to track growth patterns of plants as they progress through developmental stages and/or through the imposition, onset and recovery from stresses. All PlantScreen systems incorporate imaging stations for morphometric analysis of plants, as well as colour analysis. Options exist for full 3D reconstruction of plant architectures using a robotic scanning system that is superior to laser scattering technology. Morphometric and colour analysis may be conducted with equal effectiveness on monocotyledenous and dicotyledonous plants. Scanning is rapid for high throughput analysis, and automated protocols in software correct for any image distortions and provide accurate data of key morphometric parameters chosen by the operator. The data are collated with data from other imaging stations, if employed, to correlate changes in growth patterns with physiological responses to imposed environmental conditions. Image station collects colour picture in high resolution from different angles that can be up to range of 0 - 360°. All acquired data are collected in a database. Image station is light isolated with its own light source to ensure homogenous illumination of imaged objects with consistent quantity and quality of light. Options are available for the inclusion of novel 3D scanning technology for the most in- depth morphometric reconstruction of plants. The system can measure plants with maximum dimension 30 cm x 1m x 30 cm (w, h, l). Photon Systems Company has developed its own software for RGB image processing and morphology analysis as described in next section. 2 PSI (Photon Systems Instruments), spol. s r.o. Koláčkova 39, 621 00 Brno IČO: 60646594 DIČ: CZ60646594 RGB Morphometric Analysis Standard set-up of PlantScreen RGB Imaging station allows scanning of plants from three directions (from the sides and from the top) with a resolution of 5 MP. Images from top and side view for monocotyledons and dicotyledons plants are shown in Fig.1. 3 weeks-old Arabidopsis plants 2,5 weeks-old wheat and barley plants Fig.1 Top and side views from RGB camera. Upon acquisition of the RGB image online image processing is automatically performed and morphometric parameters are calculated. Data and picture stored in database or local PC if database is not accessible. Time acquired for the measurement and image processing is about 5 seconds. 3 PSI (Photon Systems Instruments), spol. s r.o. Koláčkova 39, 621 00 Brno IČO: 60646594 DIČ: CZ60646594 Image processing analysis consists of several successive steps that are automatically performed after image acquisition as demonstrated in Fig.2. During image processing first step performed is barrel distortion correction. In the next processing step background is substracted and subsequently tray is detected, cropped and mask is applied. Finally binary and RGB images are used as input for the morphometric analysis. Morphological analysis is performed on binary images, with white color representing the surface of the actual plant, whereas color-segmented image provides an information about condition of leaves (e.g. presence of stains and percentage rate of “healthy green” color). 1. Original image 2. Barrel distortion correction 3. Background subtraction 4. Mask detection 6. Parameter calculation Area 5. Color segmentation Fig.2 Schematic description of image processing analysis performed during morphometric analysis. 4 PSI (Photon Systems Instruments), spol. s r.o. Koláčkova 39, 621 00 Brno IČO: 60646594 DIČ: CZ60646594 Morphometric analysis developed in Photon Systems Instruments allows obtaining numerous parameters based on the binary and RGB images. Result of an image processing is the array of parameters (e.g. xls or csv), which provides basis for high-throughput on-line statistical analysis (whole trial of image processing and parameters assessment takes approximately five seconds). The set of morphological parameters, obtained from an image analysis, with additional information about experimental setup or plant genotype, creates the basis for complex evaluation of the experiment. Morphometric parameters that are computed from the automated RGB image analysis are listed below: Perimeter - Length of the plant perimeter, usually used for further computations. Area - Total area covered with plant. Values computed in certain moments should provide information about RLGR (Relative Leaf Growth Rate). It is also used, specially with perimeter and convex hull area as input for computing more complex parameters. Roundness - Ratio between area and perimeter of plant surface or its convex hull respectively. This index gives us general information about plant shape. Compactness - Ratio between Area and surface of convex hull enveloping particular plant. More “compact” plants usually have shorter petioles and massive leaf blades. Eccentricity - Parameter describing the degree of difference between convex hull area and circle, which has center in plant centroid. Radius is same, as the radius of the circle with equal surface as the Area. This scalar is then weighted with compactness. RMS (Rotational Mass Symmetry) - This is an alternative approach for general plant shape regularity evaluation. Computation is based on fitting ellipses with same second central moments as the region covered by an actual plant. RMS is then calculated as the ratio between the foci of the ellipse and its major axis length. In contrast with first Eccentricity, this parameter does not take into consideration distribution of leaf mass (in first case, eccentricity is usually higher for plants with relatively long petioles considering the leaf blade). 5 PSI (Photon Systems Instruments), spol. s r.o. Koláčkova 39, 621 00 Brno IČO: 60646594 DIČ: CZ60646594 SOL (Slenderness of Leaves) - Index, which is calculated as a ratio between square of leaf lengths (sum of distances from plant center to the end of a leaf blade) and area. Leaf colors - Represents pre-selected colors of leaves. Value of each color reports percentage of the color on plant surface. Dynamical morphological parametres that can be calculated: Relative growth rate - fast and reliable imaging of plants in time series allows to determine relative growth rate for given plant and therefore dynamically evaluate growth rate perfomance of the plants in time under specific growth conditions. Color segmentation for plant fitness evaluation Sequentially computed relative leaf growth rates Comparison of leaf area differences during whole experiment Flattening index Circadian leaf area differences Greening index Contribution of individual colours after color segmentation and characterization: Healthy Green Dark Green Light Green Other Colour – for incidental stains In case of 3D morphometric imaging other parametres can be automatically evaluated as listed below: Internodal Distances Growth Height Maximum Height and Width of Plant in 3 Dimensions 6 PSI (Photon Systems Instruments), spol. s r.o. Koláčkova 39, 621 00 Brno IČO: 60646594 DIČ: CZ60646594 Leaf Angle Leaf Number at Nodes Validation of RGB Morphometric Analysis 1. Validation with model objects For the validation step firstly objects with defined shape and dimensions were used and tested. As shown in Fig.3 all parameters were successfully validated using the model objects with known shape and dimensions. Fig.3.. Validation of the morphometric analysis. Left panel: Model objects with known shape and dimensions wer used for RGB imaging. Middle panel: Example of parameter comparison among objects in single tray. Parameter compactness is shown here. Dark green colour refers to least compact object. Right panel: Table with parameter values for statistical analysis and further processing. 2. Validation with real plants Futher the validation of morphometric analysis was done with different genotypes of Arabidopsis thaliana plants. These genotypes are characterised by different morphometric characteristics, different growth rates and greening index. The set of morphological parameters, obtained from an image analysis, with additional information about experimental setup or plant genotype, creates the basis for complex evaluation of the experiment. Each parameter can be picture roughly illustrating relative value of the parameter (in comparison with other plants in the tray; higher value means brighter hue of plant surface). Several parameters as example are shown in Fig. 4. 7 PSI (Photon Systems Instruments), spol. s r.o. Koláčkova 39, 621 00 Brno IČO: 60646594 DIČ: CZ60646594 Area Roundness HIGH LOW Eccentricity RMS HIGH LOW Fig.4.. Morphometric assessment of each individual plant on the tray. For each parameter calculated colour index picture can be used to illustrate relative value of the parameter. Table 1 below shows example of possible form of the results. Complete time series of measured parameters could be interpreted graphically, to find patterns in relation between individual parameters and plant genotype, environment conditions and developmental stage. Figure 5 illustrates two of many possible ways for graphical interpretation of the results from morphological analysis. 8 PSI (Photon Systems Instruments), spol. s r.o. Koláčkova 39, 621 00 Brno IČO: 60646594 DIČ: CZ60646594 Table 1. Example of results generated during the morphometric analysis. Fig.5 Possible graphical interpretation of the parameters; time development pattern (top), plant genotype pattern (below). 3. Validation with 5 different genotypes of Arabidopsis thaliana For the next validation step 4 individual plants of 5 different genotypes of Arabidopsis plants that display characteristic morphology pattern were used in the same tray. By using the automated morphometric analysis we aimed to demonstrate the power of the analysis in determining morphometric differences between individual plants and in non-biased identification of the given genotype based on the results of the morphometric analysis. 9 PSI (Photon Systems Instruments), spol. s r.o. Koláčkova 39, 621 00 Brno IČO: 60646594 DIČ: CZ60646594 A. C. Colour segmented binary image Application of mask with registred plant ID B. Plant ID registration with TrayRegistrator D. Solidity parametr analysis in succesive rounds Solidity 0.80 0.70 A4 0.60 A5 B1 0.50 B2 0.40 A1 0.30 A2 0.20 A3 0.10 1 5 9 13 17 21 25 29 33 37 41 45 0.00 Rounds E. F. Solidity parametr for individuals of given genotype Schematic colour grouping of the same genotypes 0.8 0.7 0.6 0.5 0.4 0.3 0.2 0.1 0 A1B3C3 D5A2B5C2 D4A4A5C1 D2A3B2C4 D1B1B4C5 D3 Fig.6 3 weeks old Arabidopsis plants of 5 different genotypes were used for the test. 4 individuals from each genotype wereimaged in one tray as shown in A). B) PlantID was registreted with PlantScreen TrayRegistrator. C) During image processing and analysis mask is automatically applied to the image and number of parameters is automatically calculated for given plant. D) 48 succesive round of image analysis. Solidity parameter is used as example to demonstrate reproducibility of image processing analysis. Several plants are shown as example. E) Colour grouping of different genotypes. Different colours are used to mark position of 4 individuals of same genotype. F) Value of solidity parameter is shown for each plant. Colour coding corresponds to E). 10 PSI (Photon Systems Instruments), spol. s r.o. Koláčkova 39, 621 00 Brno IČO: 60646594 DIČ: CZ60646594 For the validation plants were randomly placed in the tray and used for the RGB imaging in PlanScreen System. Position of the plants in the tray and their ID was registered with the TrayRegistrator Software and stored in the PlanScreen Database. As shown in figure 6 by repeating the measurement in number of successive rounds we could demonstrate the reproducibility of the imaging analysis as the standard error of the results between 48 successive rounds was in range of only 0.2-1%. Further we have tested power of the image analysis in determining the variability of the morphometric parameters between the four individuals of given genotype. As an example here we show results for solidity, area and roundness parameter (Fig. 6F and Fig. 7 A, B). Our results demonstrate that based on the image analysis we can clearly discriminate the four individuals of given genotypes. Further we can use the results of the morphometric analysis to describe specific morphometric signatures of the given genotype and use the signature as a recognition pattern of the specific phenotypic trait (Fig. 7 C, D). A. Area parameter for individuals of given genotype B. Roundness parameter for individuals of given genotype 0.3 1000 0.25 800 0.2 600 0.15 400 0.1 200 0.05 0 0 A1 B3 C3D5A2 B5 C2D4A4A5 C1D2A3 B2 C4D1 B1 B4 C5D3 C. Morphometric signature of genotype 2 A1B3 C3 D5A2B5 C2 D4A4A5C1 D2A3B2 C4 D1B1 B4 C5 D3 D. Morphometric signature of genotype 4 area area 1000 1000 100 100 10 eccentricity 1 0.1 10 perimeter eccentricity 0.01 solidity 1 0.1 perimeter 0.01 roundness solidity roundness Fig.7 A,B Values of Area and roundness parameter for each plant. Colour coding corresponds to Fig.6E. C, D) Example of morphometric signatures for two genotypes. 11 PSI (Photon Systems Instruments), spol. s r.o. Koláčkova 39, 621 00 Brno IČO: 60646594 DIČ: CZ60646594 Conclusions PlantScreen morphometric analysis provides powerful approach for detail assessment of a wide range of plant morphological parameters. Based on the grouping of the different morphological parameters specific plant traits can be easily and in reproducibly recognised. Specific trait-related morphometric pattern can be further used as recognition trait in highthroughput screening. Time-course analysis of the moprhometric pattern can be used to discriminate between developmentaly-related traits or to analyse and quantify effects of adverse abiotic or biotic conditions on growth. 12


