Math 6010–1, Fall 2014 Mini Project 1
advertisement
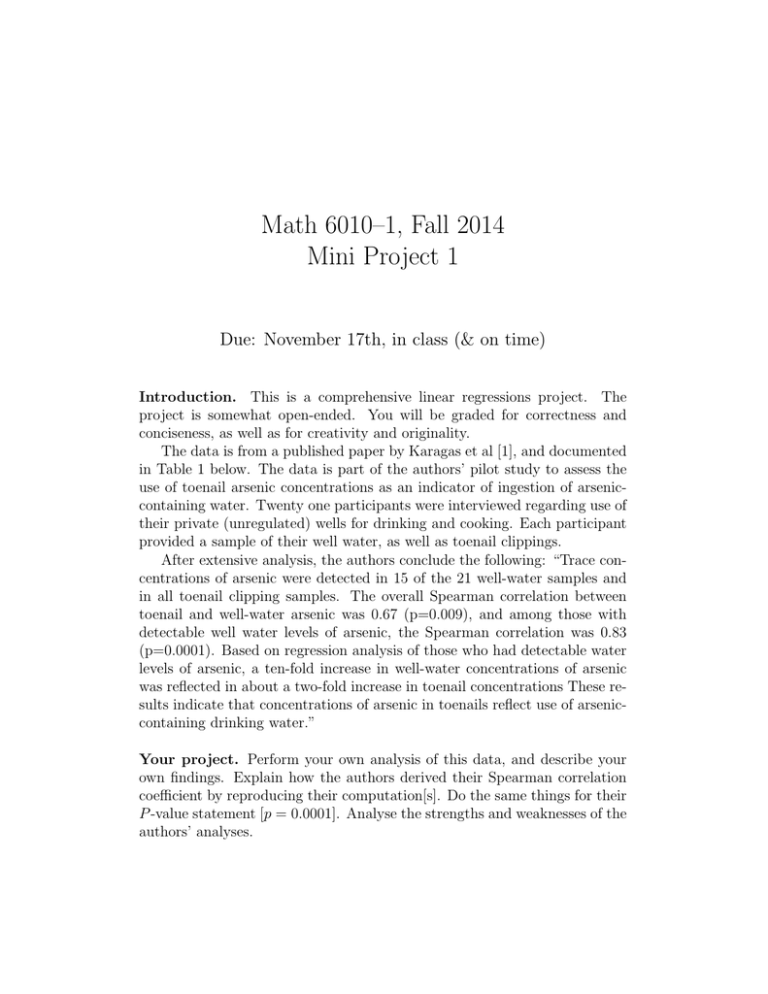
Math 6010–1, Fall 2014 Mini Project 1 Due: November 17th, in class (& on time) Introduction. This is a comprehensive linear regressions project. The project is somewhat open-ended. You will be graded for correctness and conciseness, as well as for creativity and originality. The data is from a published paper by Karagas et al [1], and documented in Table 1 below. The data is part of the authors’ pilot study to assess the use of toenail arsenic concentrations as an indicator of ingestion of arseniccontaining water. Twenty one participants were interviewed regarding use of their private (unregulated) wells for drinking and cooking. Each participant provided a sample of their well water, as well as toenail clippings. After extensive analysis, the authors conclude the following: “Trace concentrations of arsenic were detected in 15 of the 21 well-water samples and in all toenail clipping samples. The overall Spearman correlation between toenail and well-water arsenic was 0.67 (p=0.009), and among those with detectable well water levels of arsenic, the Spearman correlation was 0.83 (p=0.0001). Based on regression analysis of those who had detectable water levels of arsenic, a ten-fold increase in well-water concentrations of arsenic was reflected in about a two-fold increase in toenail concentrations These results indicate that concentrations of arsenic in toenails reflect use of arseniccontaining drinking water.” Your project. Perform your own analysis of this data, and describe your own findings. Explain how the authors derived their Spearman correlation coefficient by reproducing their computation[s]. Do the same things for their P -value statement [p = 0.0001]. Analyse the strengths and weaknesses of the authors’ analyses. Your project report must be a carefully-crafted paper, approximately 10– 15 pages long, with an abstract, introduction, carefully-documented bibliography, etc. You must include a section for detailed analysis, and a section for conclusions. Legend for the table. You might need the following facts before you can use the Table: • The variable Age denotes the age of the participant (in years); • The variable Sex denotes the sex of participant. Its value is 1 if the participant is male; its value is 2 if the participant is female; • The variable DrinkUse describes roughly how often the household well was used for drinking. A DrinkUse value of 1 represents less than 1/4 of the time; a value of 2 means approximately 1/4 of the time; a value of 3 means approximately 1/2 of the time; a value of 4 means approximately 3/4 of the time; and a value of 5 means greater than 3/4 of the time; • The variable CookUse represents how often the household well water was used for cooking: A value of 1 means < 1/4 of the time; a value of 2 means ≈ 1/4; 3 means ≈ 1/2; 4 means ≈ 3/4; and 5 means > 3/4 of the time; • The variable ArsenWater denotes the concentration of Arsenic in water, and is measured in parts per million, or ppm. Roughly, 1 ppm of Arsenic in water is equivalent to a drop of Arsenic in 50 liters of water. • The variable ArsenNails denotes the concentration of Arsenic in toenails, and is measured in ppm units. References [1] Karagas, M. R., Morris, J. S., Weiss, J. E., Spate, V., Baskett, C., and Greenberg, E. R. (1996) Toenail samples as an indicator of drinking water arsenic exposure, Cancer Epidemiology, Biomarkers and Prevention 5, 849–852. 2 Age 44 45 44 66 37 45 47 38 41 49 72 45 53 86 8 32 44 63 42 62 36 Sex 2 2 1 2 1 2 1 2 2 2 2 2 1 2 2 2 1 2 1 1 1 DrinkUse 5 4 5 3 2 5 5 4 3 4 5 1 5 5 5 5 5 5 5 5 5 CookUse 5 5 5 5 5 5 5 5 2 5 5 5 5 5 5 5 5 5 5 5 5 ArsenWater 0.00087 0.00021 0 0.00115 0 0 0.00013 0.00069 0.00039 0 0 0.046 0.0194 0.137 0.0214 0.0175 0.0764 0 0.0165 0.00012 0.0041 ArsenNails 0.119 .118 0.099 0.118 0.277 0.358 0.08 0.158 0.31 0.105 0.073 0.832 0.517 2.252 0.851 0.269 0.433 0.141 0.275 0.135 0.175 Table 1: The arsenic data by Karagas et al [1]. 3
