WCE Employer Feedback Survey 2015 Overall Results
advertisement

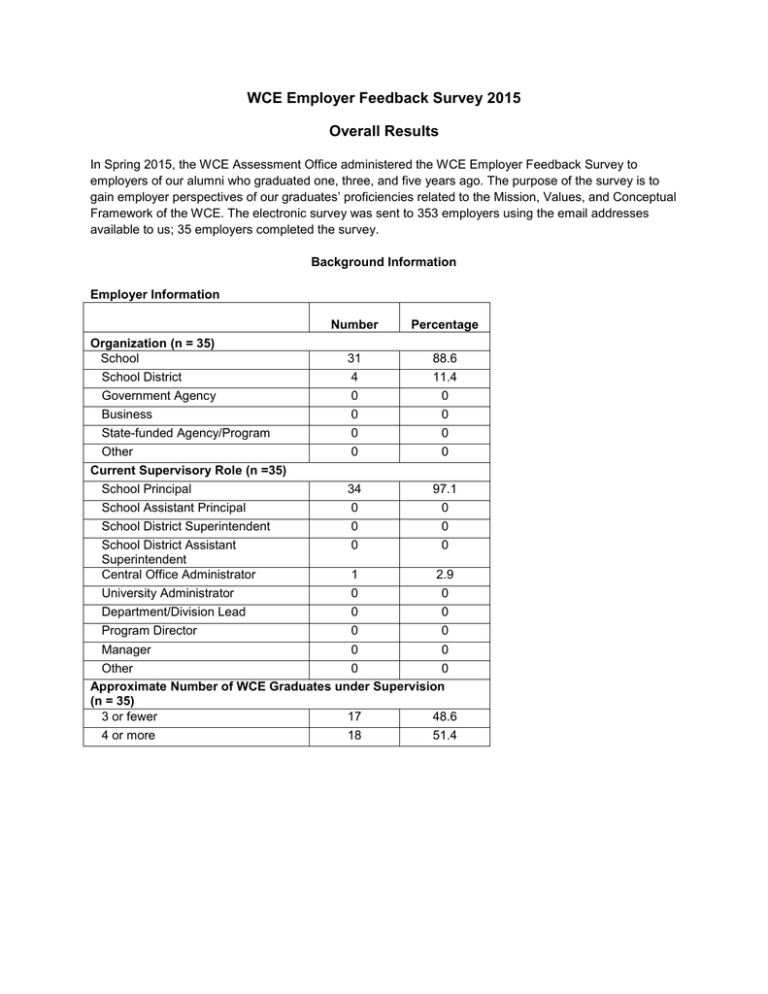
WCE Employer Feedback Survey 2015 Overall Results In Spring 2015, the WCE Assessment Office administered the WCE Employer Feedback Survey to employers of our alumni who graduated one, three, and five years ago. The purpose of the survey is to gain employer perspectives of our graduates’ proficiencies related to the Mission, Values, and Conceptual Framework of the WCE. The electronic survey was sent to 353 employers using the email addresses available to us; 35 employers completed the survey. Background Information Employer Information Number Percentage 31 88.6 School District Government Agency Business State-funded Agency/Program Other Current Supervisory Role (n =35) 4 0 0 0 0 11.4 0 0 0 0 School Principal School Assistant Principal School District Superintendent School District Assistant Superintendent Central Office Administrator University Administrator Department/Division Lead Program Director 34 0 0 0 97.1 0 0 0 1 0 0 0 2.9 0 0 0 Organization (n = 35) School Manager 0 0 Other 0 0 Approximate Number of WCE Graduates under Supervision (n = 35) 3 or fewer 17 48.6 4 or more 18 51.4 WCE Employer Feedback Survey 2015 Overall Results Rating Scale Item Results Results below include the number of employers who responded to each item (n-size), the response percentages for each item and corresponding frequency (in parentheses), and each item mean and standard deviation (SD). The “N/O” percentage is the percentage of respondents who selected “No Opportunity to Observe” out of the total number of respondents; response percentages are the percentage of respondents who selected each of the ratings out of the total number of respondents who selected a rating. 1=Strongly Disagree; 2=Disagree; 3= Do Not Know; 4=Agree; 5=Strongly Agree; N/O=No Opportunity to Observe Please indicate your OVERALL level of agreement with each of the following statements about Watson College of Education graduates based on your supervisory experiences. OVERALL, Watson College of Education graduates: Response Percentage (Frequency) Have the knowledge and skills needed to be a proficient education professional. Work well with others in the organization. Work well with external organizations (e.g., businesses, foundations, community organizations). Work well with diverse communities (e.g., organizations, groups). Effectively engage learners. Effectively assess learning. Demonstrate appropriate professional dispositions and values. Use research-based practices. Are committed to advancing the education profession. Advocate to improve schools. Advocate to improve society. Value diversity in teaching and learning. n-size 34 N/O 0 1 0 2 2.9 (1) 3 0 4 44.1 (15) 5 52.9 (18) Mean (SD) 4.47 (.66) 34 0 0 0 0 34 5.7 (2) 0 0 6.3 (2) 38.2 (13) 50.0 (16) 61.8 (21) 43.8 (14) 4.62 (.49) 4.38 (.61) 33 0 0 0 0 54.5 (18) 45.5 (15) 4.45 (.51) 34 0 0 34 2.9 (1) 0 0 34 0 0 5.9 (2) 0 3.0 (1) 2.9 (1) 2.9 (1) 54.5 (18) 52.9 (18) 44.1 (15) 42.4 (14) 38.2 (13) 52.9 (18) 4.39 (.56) 4.24 (.78) 4.50 (.56) 34 0 0 0 34 0 0 5.9 (2) 0 8.8 (3) 55.9 (19) 44.1 (15) 38.2 (13) 47.1 (16) 4.26 (.75) 4.38 (.65) 33 0 0 0 34 0 0 0 33 0 0 0 6.1 (2) 8.8 (3) 6.1 (2) 42.4 (14) 58.8 (20) 42.4 (14) 51.5 (17) 32.4 (11) 51.5 (17) 4.45 (.62) 4.24 (.61) 4.45 (.62) 2 WCE Employer Feedback Survey 2015 Overall Results Response Percentage (Frequency) Uphold ethical standards to ensure just and respectful educational practices. Use their understanding of global perspectives and practices to inspire connections and erase boundaries. Adopt new ideas/innovations to meet changing societal needs. Develop new ideas/innovations to meet changing societal needs. Demonstrate an attitude of inquiry (e.g., question, investigate, explore, and problem-solve). Develop nurturing environments essential for growth, positive relationships, and new ideas. Engage in continual reflection for learning, growth, and change. n-size 34 N/O 0 1 0 2 0 3 0 4 44.1 (15) 5 55.9 (19) Mean (SD) 4.56 (.50) 34 0 0 2.9 (1) 5.9 (2) 55.9 (19) 35.3 (12) 4.24 (.70) 33 0 0 0 9.1 (3) 51.5 (17) 39.4 (13) 4.30 (.64) 32 0 0 0 12.5 (4) 43.8 (14) 43.8 (14) 4.31 (.69) 33 2.9 (1) 0 3.1 (1) 0 59.4 (19) 37.5 (12) 4.31 (.64) 33 2.9 (1) 0 0 3.1 (1) 46.9 (15) 50.0 (16) 4.47 (.57) 33 2.9 (1) 0 0 3.1 (1) 53.1 (17) 43.8 (14) 4.41 (.56) Open-ended Item Results Employers responded to items regarding areas in which WCE graduates are performing well and areas in which they would like to see WCE graduates improve. Summaries of results are provided below. Areas in Which WCE Graduates Are Performing Well (n =28) Responses fell into the categories below. Responses that could not be categorized (i.e., were not similar to at least two other responses) are not included. The number in parentheses for each category refers to number of responses, not number of employers. Content knowledge (7) Collaboration (7) Teaching strategies (5) Professionalism (5) Reflective practitioners (5) Working with diverse students (4) Research-based practices (4) Adaptable/Flexible (3) Creative/Innovative (3) Communication (3) 3 WCE Employer Feedback Survey 2015 Overall Results Areas for Improvement (n = 23) Responses fell into the categories below. Responses that could not be categorized (i.e., were not similar to at least two other responses) are not included. The number in parentheses for each category refers to number of responses, not number of employers. Classroom management (7) Use of data to inform instruction (4) State/District curriculum, standards, initiatives (4) Professionalism (3) Reading/Literacy instruction (3) Student engagement (3) Working with diverse students/parents (3) 4


