Measurements of Trace Gas Fluxes by MAX- – spring 2009
advertisement
Measurements of Trace Gas Fluxes by MAXDOAS In Texas City, Texas – spring 2009
Elaina Shawver, George Mount and Elena Spinei
Laboratory of Atmospheric Research
Analysis
Introduction
In the spring of 2009, the Formaldehyde and
Olefin from Large Industrial Sources (FLAIR)
campaign set out as a subgroup of the Study of
Houston Atmospheric Radical Precursors
(SHARP) campaign to determine facility-wide
average emissions of SO2, HCHO and NO2 from
oil refineries in Texas City, TX by utilizing the
spatial inhomogeneity of trace gas distributions.
It is important to know the flux rates of these
molecules , as HCHO is an ozone (O3)
precursor, which is regulated by the EPA, along
with SO2 and NO2 . Two Multi-Axis Differential
Optical Absorption Spectrometers (MAX-DOAS)
operated by UCLA and WSU sampled air
masses upwind and downwind of an industrial
complex in order to calculate the fluxes of
HCHO, SO2 and NO2 emissions. Fluxes were
calculated in 2009 using a simple box analysis
but are now redone with this more robust
analysis.
Objectives
Determine facility averaged fluxes of NO2,
HCHO, and SO2 in Texas City
Determine source specific fluxes and emission
rates of HCHO, NO2, HONO, and SO2 from
pollutant sources in collaboration with other
groups
Compare results to existing Texas Commission
on Environmental Quality (TCEQ) and EPA
emission inventories for the Texas City industrial
complex.
Results
Beer’s law provides the basic physics for the analysis:
I() / Io() = exp {–( [L x i() x Ni] + εR() + εM() )}
Where,
I() is light intensity measured by the detector as a function of
wavelength for the (elevation angle, azimuth angle) observation
[counts/s]
Io() is light intensity measured by the detector as a function of
wavelength for the vertical (zenith) viewing observation [counts/s]
L is the “effective path” length of the observation [cm]
Ni is the concentration of specie “i” [molecules cm-3]
() is the photoabsorption cross section of molecule “i” [cm2]
εR() is the Rayleigh scattering extinction
εM() is the Mie scattering extinction
The red and black traces are intensities taken at a 90deg
elevation angle (short path length) and a 4 deg elevation
angle (long path length). The spectra are almost
identical, but where they differ shows absorption by
atmospheric molecules such as ozone and HCHO.
a)
b)
c)
d)
Molecular absorption cross sections
convolved with MFDOAS slit function:
a) O3 (ozone): 305 – 330 nm.
b) HCHO (formaldehyde): 300 – 330. nm
c) NO2 (nitrogen dioxide): 300 – 360 nm.
d) SO2 (sulfur dioxide): 300 – 330 nm.
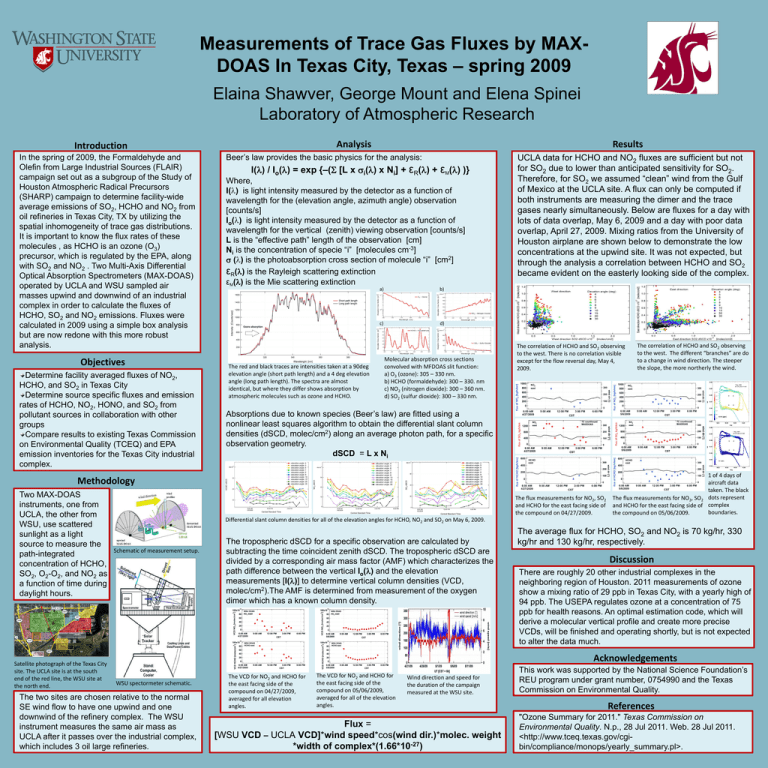
UCLA data for HCHO and NO2 fluxes are sufficient but not
for SO2 due to lower than anticipated sensitivity for SO2.
Therefore, for SO2 we assumed “clean” wind from the Gulf
of Mexico at the UCLA site. A flux can only be computed if
both instruments are measuring the dimer and the trace
gases nearly simultaneously. Below are fluxes for a day with
lots of data overlap, May 6, 2009 and a day with poor data
overlap, April 27, 2009. Mixing ratios from the University of
Houston airplane are shown below to demonstrate the low
concentrations at the upwind site. It was not expected, but
through the analysis a correlation between HCHO and SO2
became evident on the easterly looking side of the complex.
The correlation of HCHO and SO2 observing
to the west. There is no correlation visible
except for the flow reversal day, May 4,
2009.
Absorptions due to known species (Beer’s law) are fitted using a
nonlinear least squares algorithm to obtain the differential slant column
densities (dSCD, molec/cm2) along an average photon path, for a specific
observation geometry.
dSCD = L x Ni
Methodology
Two MAX-DOAS
instruments, one from
UCLA, the other from
WSU, use scattered
sunlight as a light
source to measure the
path-integrated
concentration of HCHO,
SO2, O2-O2, and NO2 as
a function of time during
daylight hours.
Satellite photograph of the Texas City
site. The UCLA site is at the south
end of the red line, the WSU site at
the north end.
The correlation of HCHO and SO2 observing
to the west. The different “branches” are do
to a change in wind direction. The steeper
the slope, the more northerly the wind.
The flux measurements for NO2, SO2
and HCHO for the east facing side of
the compound on 04/27/2009.
1 of 4 days of
aircraft data
taken. The black
The flux measurements for NO2, SO2 dots represent
and HCHO for the east facing side of complex
boundaries.
the compound on 05/06/2009.
Differential slant column densities for all of the elevation angles for HCHO, NO2 and SO2 on May 6, 2009.
Schematic of measurement setup.
The tropospheric dSCD for a specific observation are calculated by
subtracting the time coincident zenith dSCD. The tropospheric dSCD are
divided by a corresponding air mass factor (AMF) which characterizes the
path difference between the vertical Io() and the elevation
measurements [I()] to determine vertical column densities (VCD,
molec/cm2).The AMF is determined from measurement of the oxygen
dimer which has a known column density.
The average flux for HCHO, SO2 and NO2 is 70 kg/hr, 330
kg/hr and 130 kg/hr, respectively.
Discussion
There are roughly 20 other industrial complexes in the
neighboring region of Houston. 2011 measurements of ozone
show a mixing ratio of 29 ppb in Texas City, with a yearly high of
94 ppb. The USEPA regulates ozone at a concentration of 75
ppb for health reasons. An optimal estimation code, which will
derive a molecular vertical profile and create more precise
VCDs, will be finished and operating shortly, but is not expected
to alter the data much.
Acknowledgements
WSU spectormeter schematic.
The two sites are chosen relative to the normal
SE wind flow to have one upwind and one
downwind of the refinery complex. The WSU
instrument measures the same air mass as
UCLA after it passes over the industrial complex,
which includes 3 oil large refineries.
The VCD for NO2 and HCHO for
the east facing side of the
compound on 04/27/2009,
averaged for all elevation
angles.
The VCD for NO2 and HCHO for
the east facing side of the
compound on 05/06/2009,
averaged for all of the elevation
angles.
Wind direction and speed for
the duration of the campaign
measured at the WSU site.
Flux =
[WSU VCD – UCLA VCD]*wind speed*cos(wind dir.)*molec. weight
*width of complex*(1.66*10-27)
This work was supported by the National Science Foundation’s
REU program under grant number, 0754990 and the Texas
Commission on Environmental Quality.
References
"Ozone Summary for 2011." Texas Commission on
Environmental Quality. N.p., 28 Jul 2011. Web. 28 Jul 2011.
<http://www.tceq.texas.gov/cgibin/compliance/monops/yearly_summary.pl>.
