Analysis of Turbulence driving the Canopy-Atmosphere Exchange at CABINEX 2009
advertisement

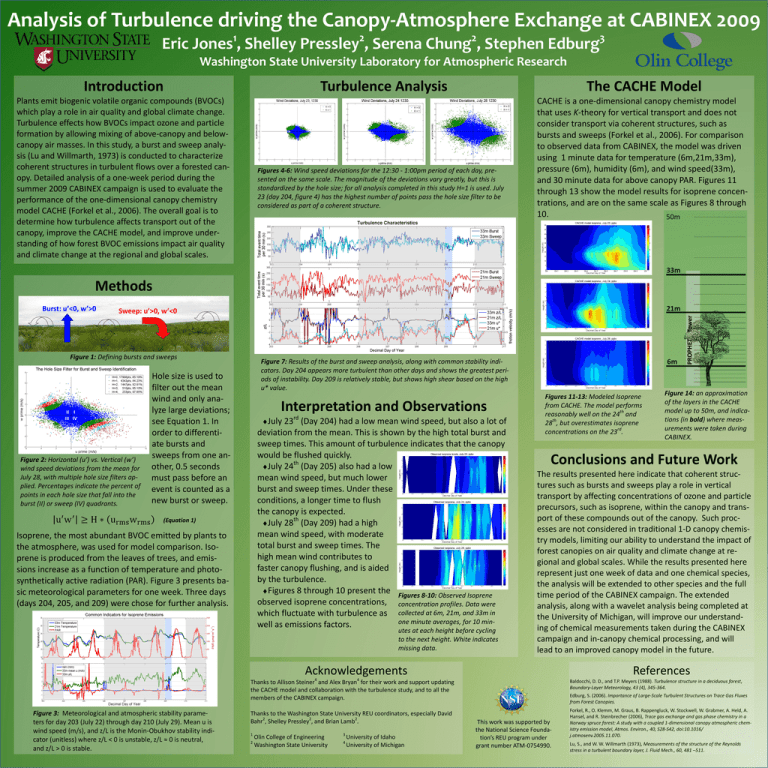
Analysis of Turbulence driving the Canopy-Atmosphere Exchange at CABINEX 2009 1 2 2 3 Eric Jones , Shelley Pressley , Serena Chung , Stephen Edburg Washington State University Laboratory for Atmospheric Research Introduction Turbulence Analysis Plants emit biogenic volatile organic compounds (BVOCs) which play a role in air quality and global climate change. Turbulence effects how BVOCs impact ozone and particle formation by allowing mixing of above-canopy and belowcanopy air masses. In this study, a burst and sweep analysis (Lu and Willmarth, 1973) is conducted to characterize coherent structures in turbulent flows over a forested canopy. Detailed analysis of a one-week period during the summer 2009 CABINEX campaign is used to evaluate the performance of the one-dimensional canopy chemistry model CACHE (Forkel et al., 2006). The overall goal is to determine how turbulence affects transport out of the canopy, improve the CACHE model, and improve understanding of how forest BVOC emissions impact air quality and climate change at the regional and global scales. The CACHE Model Figures 4-6: Wind speed deviations for the 12:30 - 1:00pm period of each day, presented on the same scale. The magnitude of the deviations vary greatly, but this is standardized by the hole size; for all analysis completed in this study H=1 is used. July 23 (day 204, figure 4) has the highest number of points pass the hole size filter to be considered as part of a coherent structure. CACHE is a one-dimensional canopy chemistry model that uses K-theory for vertical transport and does not consider transport via coherent structures, such as bursts and sweeps (Forkel et al., 2006). For comparison to observed data from CABINEX, the model was driven using 1 minute data for temperature (6m,21m,33m), pressure (6m), humidity (6m), and wind speed(33m), and 30 minute data for above canopy PAR. Figures 11 through 13 show the model results for isoprene concentrations, and are on the same scale as Figures 8 through 10. 50m 33m Methods 21m Sweep: u’>0, w’<0 Figure 1: Defining bursts and sweeps II I III IV Figure 2: Horizontal (u’) vs. Vertical (w’) wind speed deviations from the mean for July 28, with multiple hole size filters applied. Percentages indicate the percent of points in each hole size that fall into the burst (II) or sweep (IV) quadrants. 6m Figure 7: Results of the burst and sweep analysis, along with common stability indicators. Day 204 appears more turbulent than other days and shows the greatest periods of instability. Day 209 is relatively stable, but shows high shear based on the high u* value. Hole size is used to filter out the mean wind and only analyze large deviations; see Equation 1. In order to differentiate bursts and sweeps from one another, 0.5 seconds must pass before an event is counted as a new burst or sweep. Interpretation and Observations rd July 23 (Day 204) had a low mean wind speed, but also a lot of deviation from the mean. This is shown by the high total burst and sweep times. This amount of turbulence indicates that the canopy would be flushed quickly. th July 24 (Day 205) also had a low mean wind speed, but much lower burst and sweep times. Under these conditions, a longer time to flush the canopy is expected. th July 28 (Day 209) had a high mean wind speed, with moderate total burst and sweep times. The high mean wind contributes to faster canopy flushing, and is aided by the turbulence. Figures 8 through 10 present the Figures 8-10: Observed Isoprene observed isoprene concentrations, concentration profiles. Data were which fluctuate with turbulence as collected at 6m, 21m, and 33m in one minute averages, for 10 minwell as emissions factors. (Equation 1) Isoprene, the most abundant BVOC emitted by plants to the atmosphere, was used for model comparison. Isoprene is produced from the leaves of trees, and emissions increase as a function of temperature and photosynthetically active radiation (PAR). Figure 3 presents basic meteorological parameters for one week. Three days (days 204, 205, and 209) were chose for further analysis. utes at each height before cycling to the next height. White indicates missing data. Figures 11-13: Modeled Isoprene from CACHE. The model performs th reasonably well on the 24 and 28th, but overestimates isoprene rd concentrations on the 23 . Figure 14: an approximation of the layers in the CACHE model up to 50m, and indications (in bold) where measurements were taken during CABINEX. Conclusions and Future Work The results presented here indicate that coherent structures such as bursts and sweeps play a role in vertical transport by affecting concentrations of ozone and particle precursors, such as isoprene, within the canopy and transport of these compounds out of the canopy. Such processes are not considered in traditional 1-D canopy chemistry models, limiting our ability to understand the impact of forest canopies on air quality and climate change at regional and global scales. While the results presented here represent just one week of data and one chemical species, the analysis will be extended to other species and the full time period of the CABINEX campaign. The extended analysis, along with a wavelet analysis being completed at the University of Michigan, will improve our understanding of chemical measurements taken during the CABINEX campaign and in-canopy chemical processing, and will lead to an improved canopy model in the future. Acknowledgements Figure 3: Meteorological and atmospheric stability parameters for day 203 (July 22) through day 210 (July 29). Mean u is wind speed (m/s), and z/L is the Monin-Obukhov stability indicator (unitless) where z/L < 0 is unstable, z/L ≈ 0 is neutral, and z/L > 0 is stable. PROPHET Tower Burst: u’<0, w’>0 References Thanks to Allison Steiner4 and Alex Bryan4 for their work and support updating the CACHE model and collaboration with the turbulence study, and to all the members of the CABINEX campaign. Baldocchi, D. D., and T.P. Meyers (1988). Turbulence structure in a deciduous forest, Boundary-Layer Meteorology, 43 (4), 345-364. Thanks to the Washington State University REU coordinators, especially David Bahr2, Shelley Pressley2, and Brian Lamb2. Forkel, R., O. Klemm, M. Graus, B. Rappengluck, W. Stockwell, W. Grabmer, A. Held, A. Hansel, and R. Steinbrecher (2006), Trace gas exchange and gas phase chemistry in a Norway spruce forest: A study with a coupled 1-dimensional canopy atmospheric chemistry emission model, Atmos. Environ., 40, S28-S42, doi:10.1016/ j.atmosenv.2005.11.070. 1 Olin College of Engineering 2 Washington State University 3 University of Idaho 4 University of Michigan Edburg, S. (2006). Importance of Large-Scale Turbulent Structures on Trace Gas Fluxes from Forest Canopies. This work was supported by the National Science Foundation’s REU program under grant number ATM-0754990. Lu, S., and W. W. Willmarth (1973), Measurements of the structure of the Reynolds stress in a turbulent boundary layer, J. Fluid Mech., 60, 481 –511.


