PANORAMA
advertisement

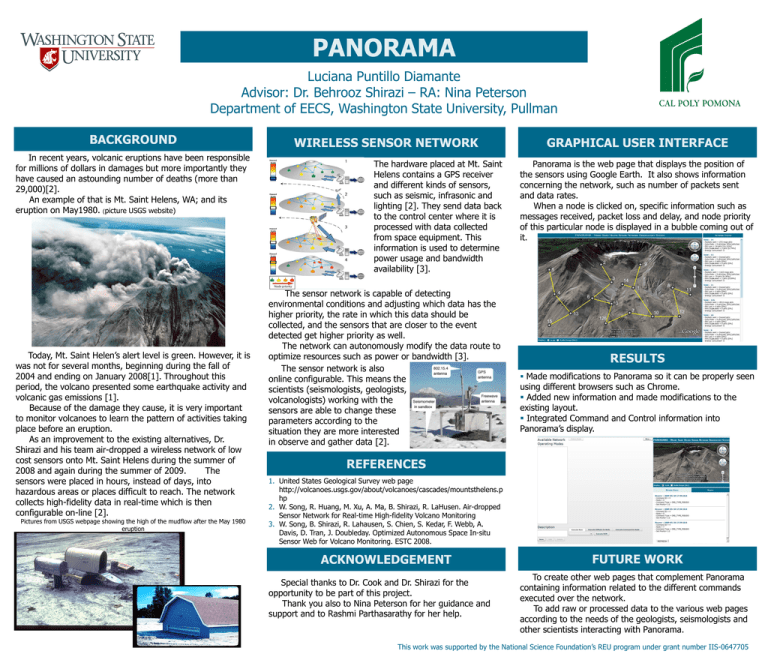
PANORAMA Luciana Puntillo Diamante Advisor: Dr. Behrooz Shirazi – RA: Nina Peterson Department of EECS, Washington State University, Pullman BACKGROUND In recent years, volcanic eruptions have been responsible for millions of dollars in damages but more importantly they have caused an astounding number of deaths (more than 29,000)[2]. An example of that is Mt. Saint Helens, WA; and its eruption on May1980. (picture USGS website) Today, Mt. Saint Helen’s alert level is green. However, it is was not for several months, beginning during the fall of 2004 and ending on January 2008[1]. Throughout this period, the volcano presented some earthquake activity and volcanic gas emissions [1]. Because of the damage they cause, it is very important to monitor volcanoes to learn the pattern of activities taking place before an eruption. As an improvement to the existing alternatives, Dr. Shirazi and his team air-dropped a wireless network of low cost sensors onto Mt. Saint Helens during the summer of 2008 and again during the summer of 2009. The sensors were placed in hours, instead of days, into hazardous areas or places difficult to reach. The network collects high-fidelity data in real-time which is then configurable on-line [2]. Pictures from USGS webpage showing the high of the mudflow after the May 1980 eruption WIRELESS SENSOR NETWORK The hardware placed at Mt. Saint Helens contains a GPS receiver and different kinds of sensors, such as seismic, infrasonic and lighting [2]. They send data back to the control center where it is processed with data collected from space equipment. This information is used to determine power usage and bandwidth availability [3]. The sensor network is capable of detecting environmental conditions and adjusting which data has the higher priority, the rate in which this data should be collected, and the sensors that are closer to the event detected get higher priority as well. The network can autonomously modify the data route to optimize resources such as power or bandwidth [3]. The sensor network is also online configurable. This means the scientists (seismologists, geologists, volcanologists) working with the sensors are able to change these parameters according to the situation they are more interested in observe and gather data [2]. GRAPHICAL USER INTERFACE Panorama is the web page that displays the position of the sensors using Google Earth. It also shows information concerning the network, such as number of packets sent and data rates. When a node is clicked on, specific information such as messages received, packet loss and delay, and node priority of this particular node is displayed in a bubble coming out of it. RESULTS Made modifications to Panorama so it can be properly seen using different browsers such as Chrome. Added new information and made modifications to the existing layout. Integrated Command and Control information into Panorama’s display. REFERENCES 1. United States Geological Survey web page http://volcanoes.usgs.gov/about/volcanoes/cascades/mountsthelens.p hp 2. W. Song, R. Huang, M. Xu, A. Ma, B. Shirazi, R. LaHusen. Air-dropped Sensor Network for Real-time High-fidelity Volcano Monitoring 3. W. Song, B. Shirazi, R. Lahausen, S. Chien, S. Kedar, F. Webb, A. Davis, D. Tran, J. Doubleday. Optimized Autonomous Space In-situ Sensor Web for Volcano Monitoring. ESTC 2008. ACKNOWLEDGEMENT Special thanks to Dr. Cook and Dr. Shirazi for the opportunity to be part of this project. Thank you also to Nina Peterson for her guidance and support and to Rashmi Parthasarathy for her help. FUTURE WORK To create other web pages that complement Panorama containing information related to the different commands executed over the network. To add raw or processed data to the various web pages according to the needs of the geologists, seismologists and other scientists interacting with Panorama. This work was supported by the National Science Foundation’s REU program under grant number IIS-0647705


