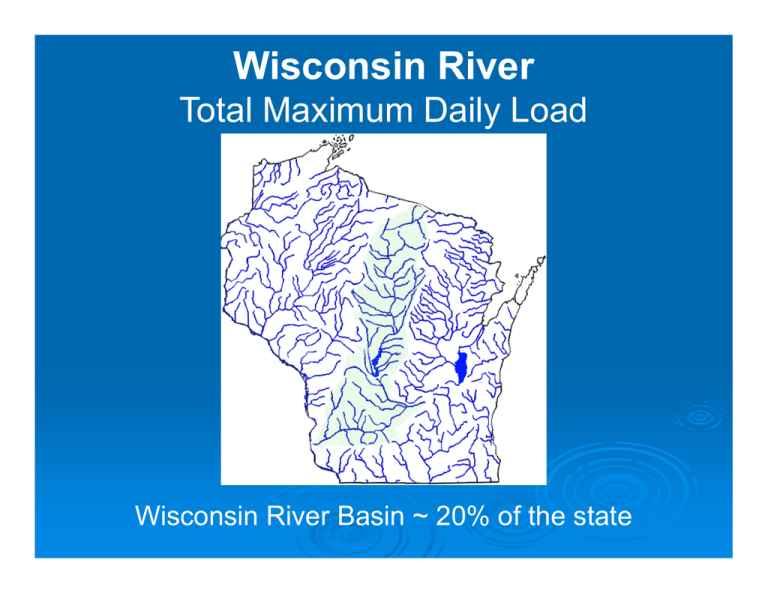
Wisconsin River Total Maximum Daily Load
advertisement

Wisconsin River Total Maximum Daily Load Wisconsin River Basin ~ 20% of the state Wisconsin State Statutory Language (2009) 281.14 Wisconsin River monitoring and study. The department shall conduct a program to monitor and study the introduction of nutrients from point sources and nonpoint sources into the Wisconsin River … Great Start, but we need implementation People Working! Efforts to reduce P ongoing Working with partners to hit the landscape Information and Education to landowners Other groups getting involved Lake Wisconsin PACRS BEPCO Friends of Mill Creek Lake Wausau Assoc. Rib Mountain Business Assoc. Multi-Agency Q & A Reduction of P Ongoing Point Source to the Wisconsin River above the Petenwell Flowage about half of their pre-1992 levels. Estimated Annual Phosphorous Point Source Loading Phosphorus Discharge (lbs) 800,000 700,000 600,000 500,000 400,000 300,000 200,000 100,000 0 1993 or First Year 1994 1995 1996 1997 1998 1999 2000 Upper WI Basin 2001 2002 2003 2004 Central WI Basin 2005 2006 2007 Wisconsin River Basin - At Castle Rock Dam *Phos. Estimated Load (546 MT/yr) Land Use 3% 3% 1% 29% 37% Urban Agriculture Grass/Pasture Wetlands Forest Open Water Point Sources 26% 0% 52% 7% 13% 17% 4% 8% * unadjusted or limited data People Working for NPS Don’t reinvent the wheel Efforts to reduce P Working with partners to hit the landscape Information and Education to landowners Other groups getting involved Lake Wisconsin DBA PACRS LWCD’s BEPCO NFO Friends of Mill Creek DATCP Lake Wausau Assoc. Municipalities Rib Mountain Business Assoc. Stay positive; work together and we’ll get there


