Mixing Crystal Lake to Eradicate Osmerus mordax Zach Lawson Dr. Jake VanderZanden, Dr. Steve Carpenter, Dr. Tom Hrabik
advertisement
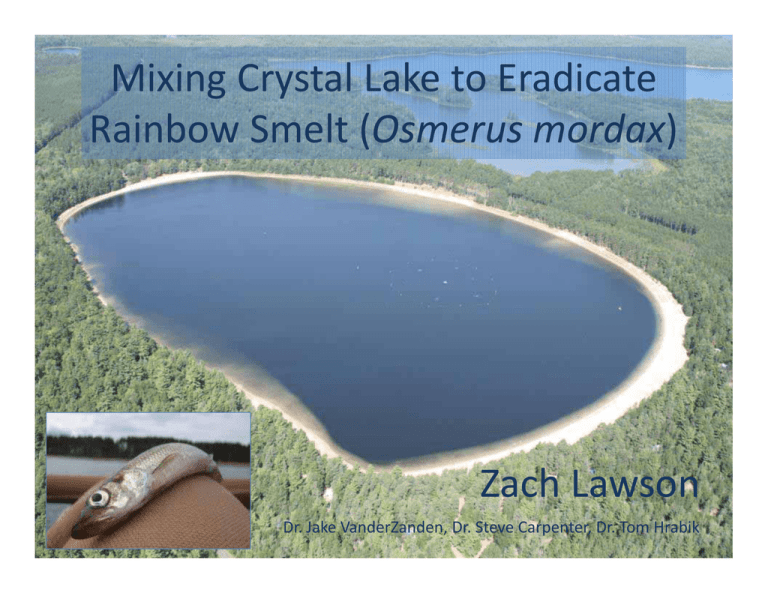
Mixing Crystal Lake to Eradicate Rainbow Smelt (Osmerus mordax) Zach Lawson Dr. Jake VanderZanden, Dr. Steve Carpenter, Dr. Tom Hrabik Today’s Presentation • • • • Crystal Lake/Rainbow Smelt Manipulation Design Mixing Results Smelt Responses Crystal Lake N Rainbow Smelt in the US Where are smelt now? ~25 lakes Rainbow smelt impacts in our lakes • Reduce cisco/whitefish populations • Reduce yellow perch populations • Reduce walleye recruitment Evans and Loftus 1987, Hrabik et al. 1998; 2001, Mercado Silva et al. 2007 Photo by: John Lyons Available Smelt Habitat Expected Effects on Smelt Gaeta et al. 2012 Mixing System Mixing Design •6 GELIs •~10,000 cycles/season (4‐5 months) •20m of travel Water Quality Monitoring Biological Community Sampling 2012 Mixing Results 2012 Historical Temperatures 2012 Mixing Results 2012 Historical Temperatures 2012 Mixing Results Smelt Responses to Mixing •Shifts in Behavior •Observed Mortality 2012 Body Condition 2012 Body Condition Population Dynamics Population Dynamics Hidden from Sonar h = hiding rate Visible to Sonar P T‐P v = rate of becoming visible T = total number of smelt in Crystal Lake m = mortality rate Population Dynamics M ~ 0.4 M ~ 0.9 Conclusions •Smelt population declined, but mortality rate remains uncertain •Some smelt remain in Crystal •Waiting for ice to melt for an update Crystal Mixers Page Mieritz Wes Matthews Tom Thalhuber Ali Branscombe Colin Smith Eric Brown Zach Lawson Jordan Read Acknowledgements Anonymous donor WDNR Trout Lake Station Crystal Lake Contact Station Questions? Mortality Model dP bP cemt dt T mt dP bPdt ce dt ] [ 0 c mT PT P0 bPT 1 e m c 1 mT Pt P0 1 e m 1 b Habitat Availability Pre ‐ Body Condition Chlorophyll CR Leptodora 160 140 120 #/m3 100 80 60 40 20 0 1980 1985 1990 1995 2000 2005 2010 2015 3.2 Smelt Throughout 2012 2.6 2.4 2.2 2.0 1.8 log Weight (g) 2.8 3.0 3 4 5 6 7 8 9 10 4.7 4.8 4.9 log Length (mm) 5.0 5.1 Onshore Movement Average Total Diet Wet Weight (g) Rainbow Smelt Diets 0.5 Onshore (n=43) Offshore (n=46) 0.4 0.3 0.2 0.1 0.0 213 230 257 Julian Day 271 RWS Growth Rates Pre/Manipulation comparison 15 5 0 150 250 350 0 50 150 250 Time of Year Time of Year Littoral night 2011 Littoral night 2012 350 15 10 5 0 0 5 10 CPUE 15 20 50 20 0 CPUE 10 CPUE 10 0 5 CPUE 15 20 Littoral day 2012 20 Littoral day 2011 0 50 150 250 Time of Year 350 0 50 150 250 Time of Year 350 1.5 0.5 0.0 150 250 350 0 50 150 250 Time of Year Time of Year Pelagic night 2011 Pelagic night 2012 350 1.5 1.0 0.5 0.0 0.0 0.5 1.0 CPUE 1.5 2.0 50 2.0 0 CPUE 1.0 CPUE 1.0 0.0 0.5 CPUE 1.5 2.0 Pelagic day 2012 2.0 Pelagic day 2011 0 50 150 250 Time of Year 350 0 50 150 250 Time of Year 350 Smelt Thermal Habitat Smelt Habitat Temperature How many lakes have suitable habitat? 553 lakes Project Timeline Manipulation starts Baseline Monitoring Test Mix Monitoring Mixing 2010 2011 2012 Manipulation ends Mixing 2013 Monitor Lake 2014…
