Staff Numbers by Ethnicity, Staff group and Faculty/Service Area as... Academics
advertisement
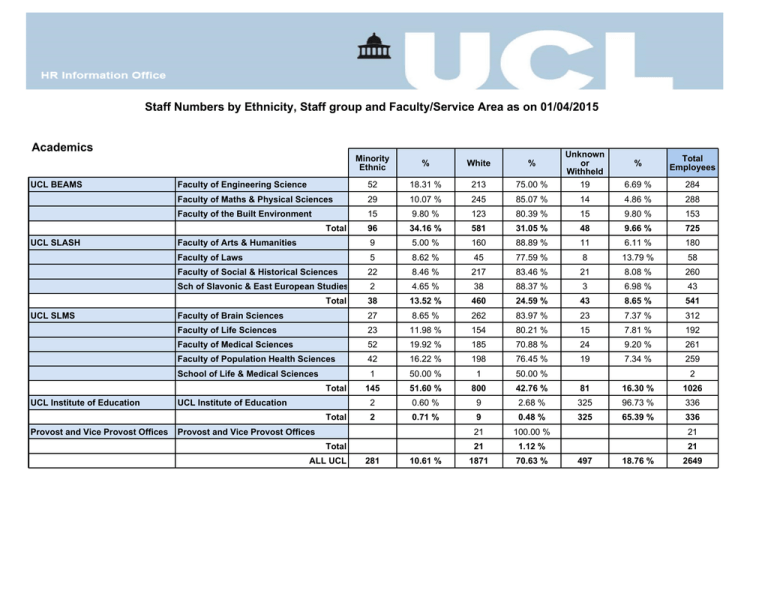
Staff Numbers by Ethnicity, Staff group and Faculty/Service Area as on 01/04/2015 Academics UCL BEAMS % Total Employees 75.00 % Unknown or Withheld 19 6.69 % 284 245 85.07 % 14 4.86 % 288 123 80.39 % 15 9.80 % 153 34.16 % 581 31.05 % 48 9.66 % 725 9 5.00 % 160 88.89 % 11 6.11 % 180 Faculty of Laws 5 8.62 % 45 77.59 % 8 13.79 % 58 Faculty of Social & Historical Sciences 22 8.46 % 217 83.46 % 21 8.08 % 260 Sch of Slavonic & East European Studies 2 4.65 % 38 88.37 % 3 6.98 % 43 Total 38 13.52 % 460 24.59 % 43 8.65 % 541 Minority Ethnic % White % Faculty of Engineering Science 52 18.31 % 213 Faculty of Maths & Physical Sciences 29 10.07 % Faculty of the Built Environment 15 9.80 % 96 Total UCL SLASH UCL SLMS Faculty of Arts & Humanities Faculty of Brain Sciences 27 8.65 % 262 83.97 % 23 7.37 % 312 Faculty of Life Sciences 23 11.98 % 154 80.21 % 15 7.81 % 192 Faculty of Medical Sciences 52 19.92 % 185 70.88 % 24 9.20 % 261 Faculty of Population Health Sciences 42 16.22 % 198 76.45 % 19 7.34 % 259 School of Life & Medical Sciences Total UCL Institute of Education UCL Institute of Education Total Provost and Vice Provost Offices 1 50.00 % 1 50.00 % 145 51.60 % 800 42.76 % 81 16.30 % 1026 2 0.60 % 9 2.68 % 325 96.73 % 336 2 0.71 % 9 0.48 % 325 65.39 % 336 21 100.00 % 21 21 1.12 % 21 1871 70.63 % Provost and Vice Provost Offices Total ALL UCL 281 10.61 % 2 497 18.76 % 2649 Staff Numbers by Ethnicity, Staff group and Faculty/Service Area as on 01/04/2015 Researchers UCL BEAMS 67.62 % 63 16.45 % 383 93 24.28 % 241 Faculty of Maths & Physical Sciences 61 15.93 % 18 16.36 % 78 70.91 % 14 12.73 % 110 172 29.76 % 578 25.78 % 126 19.94 % 876 Faculty of Arts & Humanities 3 8.57 % 24 68.57 % 8 22.86 % 35 Faculty of Laws 5 31.25 % 11 68.75 % Faculty of Social & Historical Sciences 17 14.05 % 91 75.21 % 13 10.74 % 121 9 90.00 % 1 10.00 % 10 16 25 4.33 % 135 6.02 % 22 3.48 % 182 Faculty of Brain Sciences 97 14.24 % 472 69.31 % 112 16.45 % 681 Faculty of Life Sciences 68 17.53 % 270 69.59 % 50 12.89 % 388 Faculty of Medical Sciences 94 18.08 % 300 57.69 % 126 24.23 % 520 Faculty of Population Health Sciences 118 17.28 % 459 67.20 % 106 15.52 % 683 377 65.22 % 1501 66.95 % 394 62.34 % 2272 1 1.00 % 10 10.00 % 89 89.00 % 100 1 0.17 % 10 0.45 % 89 14.08 % 100 3 15.00 % 16 80.00 % 1 5.00 % 20 3 0.52 % 16 0.71 % 1 0.16 % 20 2 100.00 % 2 2 0.09 % 2 2242 64.95 % Total UCL Institute of Education Total Provost and Vice Provost Offices Total Professional Services 259 Faculty of Engineering Science Total Provost and Vice Provost Offices 383 % Sch of Slavonic & East European Studies UCL Institute of Education 12.79 % White Total UCL SLMS Total Employees % Faculty of the Built Environment UCL SLASH % 62.92 % Unknown or Withheld 49 Minority Ethnic Professional Services Total ALL UCL 578 16.74 % 632 18.31 % 3452 Staff Numbers by Ethnicity, Staff group and Faculty/Service Area as on 01/04/2015 NHS Related Minority Ethnic UCL BEAMS % Faculty of Engineering Science Total UCL SLMS 1 100.00 % 1 1 1.49 % 1 21 87.50 % 1 4.17 % Faculty of Life Sciences 1 100.00 % Faculty of Medical Sciences 11 29.73 % 18 48.65 % 8 21.62 % 37 Faculty of Population Health Sciences 3 10.34 % 21 72.41 % 5 17.24 % 29 16 94.12 % 60 89.55 % 15 93.75 % 91 1 100.00 % 1 1 6.25 % 1 UCL Institute of Education Professional Services 1 14.29 % 8.33 % 24 1 Total Professional Services 2 % Total Employees % Faculty of Brain Sciences Total UCL Institute of Education Unknown or Withheld White 6 85.71 % Total 1 5.88 % 6 8.96 % ALL UCL 17 17.00 % 67 67.00 % 7 7 16 16.00 % 100 Staff Numbers by Ethnicity, Staff group and Faculty/Service Area as on 01/04/2015 Teachers & TAs UCL BEAMS % Total Employees 72.73 % Unknown or Withheld 11 14.29 % 77 18 78.26 % 2 8.70 % 23 10.74 % 95 78.51 % 13 10.74 % 121 23.85 % 169 27.57 % 26 17.81 % 221 4 4.21 % 76 80.00 % 15 15.79 % 95 Faculty of Laws 5 8.33 % 42 70.00 % 13 21.67 % 60 Faculty of Social & Historical Sciences 11 12.50 % 62 70.45 % 15 17.05 % 88 Sch of Slavonic & East European Studies 1 4.35 % 18 78.26 % 4 17.39 % 23 Total 21 19.27 % 198 32.30 % 47 32.19 % 266 4 11.76 % 26 76.47 % 4 11.76 % 34 Faculty of Life Sciences 6 25.00 % 14 58.33 % 4 16.67 % 24 Faculty of Medical Sciences 16 35.56 % 22 48.89 % 7 15.56 % 45 Faculty of Population Health Sciences 4 14.81 % 17 62.96 % 6 22.22 % 27 30 27.52 % 79 12.89 % 21 14.38 % 130 17 100.00 % 17 17 11.64 % 17 Minority Ethnic % White % Faculty of Engineering Science 10 12.99 % 56 Faculty of Maths & Physical Sciences 3 13.04 % Faculty of the Built Environment 13 26 Faculty of Arts & Humanities Total UCL SLASH UCL SLMS Faculty of Brain Sciences Total UCL Institute of Education UCL Institute of Education Total Provost and Vice Provost Offices Provost and Vice Provost Offices Total Professional Services 32 13.73 % 166 71.24 % 35 15.02 % 233 32 29.36 % 166 27.08 % 35 23.97 % 233 1 100.00 % 1 1 0.16 % 1 613 70.62 % Professional Services Total ALL UCL 109 12.56 % 146 16.82 % 868 Staff Numbers by Ethnicity, Staff group and Faculty/Service Area as on 01/04/2015 Administration/Managerial Support UCL BEAMS % Total Employees 71.93 % Unknown or Withheld 17 9.94 % 171 101 74.81 % 11 8.15 % 135 19.19 % 69 69.70 % 11 11.11 % 99 9.88 % 293 12.06 % 39 4.94 % 405 5 7.81 % 51 79.69 % 8 12.50 % 64 Faculty of Laws 5 17.24 % 22 75.86 % 2 6.90 % 29 Faculty of Social & Historical Sciences 17 15.60 % 84 77.06 % 8 7.34 % 109 Sch of Slavonic & East European Studies 2 10.53 % 13 68.42 % 4 21.05 % 19 Total 29 3.92 % 170 7.00 % 22 2.79 % 221 Faculty of Brain Sciences 53 21.03 % 187 74.21 % 12 4.76 % 252 Faculty of Life Sciences 19 18.10 % 79 75.24 % 7 6.67 % 105 Faculty of Medical Sciences 77 25.50 % 198 65.56 % 27 8.94 % 302 Faculty of Population Health Sciences 101 22.05 % 285 62.23 % 72 15.72 % 458 9 100.00 % Minority Ethnic % White % Faculty of Engineering Science 31 18.13 % 123 Faculty of Maths & Physical Sciences 23 17.04 % Faculty of the Built Environment 19 73 Faculty of Arts & Humanities Total UCL SLASH UCL SLMS School of Life & Medical Sciences Total UCL Institute of Education UCL Institute of Education Total Provost and Vice Provost Offices Provost and Vice Provost Offices Professional Services Professional Services Total 9 250 33.83 % 758 31.19 % 118 14.96 % 1126 9 1.89 % 15 3.14 % 453 94.97 % 477 9 1.22 % 15 0.62 % 453 57.41 % 477 36 16.51 % 145 66.51 % 37 16.97 % 218 36 4.87 % 145 5.97 % 37 4.69 % 218 342 22.63 % 1049 69.42 % 120 7.94 % 1511 Total 342 46.28 % 1049 43.17 % 120 15.21 % 1511 ALL UCL 739 18.67 % 2430 61.39 % 789 19.93 % 3958 Staff Numbers by Ethnicity, Staff group and Faculty/Service Area as on 01/04/2015 Manual and Craft UCL BEAMS Faculty of Engineering Science Minority Ethnic % 1 100.00 % White % Total 1 3.45 % Faculty of Social & Historical Sciences Total UCL SLMS Faculty of Brain Sciences Faculty of Life Sciences 3 37.50 % Faculty of Medical Sciences 1 50.00 % 4 13.79 % Total UCL Institute of Education UCL Institute of Education Professional Services Professional Services % Total Employees 1 Faculty of Maths & Physical Sciences UCL SLASH Unknown or Withheld 2 100.00 % 2 2 11.76 % 3 1 100.00 % 1 1 1.59 % 1 1 100.00 % 1 5 62.50 % 6 9.52 % Total 8 1 50.00 % 2 1 5.88 % 11 2 100.00 % 2 2 11.76 % 2 24 26.09 % 56 60.87 % 12 13.04 % 92 Total 24 82.76 % 56 88.89 % 12 70.59 % 92 ALL UCL 29 26.61 % 63 57.80 % 17 15.60 % 109 Staff Numbers by Ethnicity, Staff group and Faculty/Service Area as on 01/04/2015 Technicians UCL BEAMS 59 56 65.88 % 11 12.94 % 85 3 100.00 % 104 17.28 % 13 10.16 % 147 % Faculty of Engineering Science 12 20.34 % 45 Faculty of Maths & Physical Sciences 18 21.18 % 30 18.75 % Faculty of Arts & Humanities 1 20.00 % 4 80.00 % Faculty of Social & Historical Sciences 2 2.00 % 70 70.00 % 28 28.00 % 100 Total 3 1.88 % 74 12.29 % 28 21.88 % 105 22.58 % 91 73.39 % 5 4.03 % 124 Faculty of Life Sciences 29 24.17 % 81 67.50 % 10 8.33 % 120 Faculty of Medical Sciences 47 23.86 % 112 56.85 % 38 19.29 % 197 10 15.87 % 44 69.84 % 9 14.29 % 63 114 71.25 % 328 54.49 % 62 48.44 % 504 14 100.00 % 14 14 10.94 % 14 UCL Institute of Education Total Provost and Vice Provost Offices Total Professional Services 5 28 Total Provost and Vice Provost Offices 3 Faculty of Brain Sciences Faculty of Population Health Sciences UCL Institute of Education 3.39 % White Total UCL SLMS Total Employees % Faculty of the Built Environment UCL SLASH % 76.27 % Unknown or Withheld 2 Minority Ethnic Professional Services 3 100.00 % 3 3 0.50 % 3 13 11.11 % 93 79.49 % 11 9.40 % 117 Total 13 8.13 % 93 15.45 % 11 8.59 % 117 ALL UCL 160 17.98 % 602 67.64 % 128 14.38 % 890
