Staff Numbers by Ethnicity and Faculty/Service Area as on 01/04/2015
advertisement
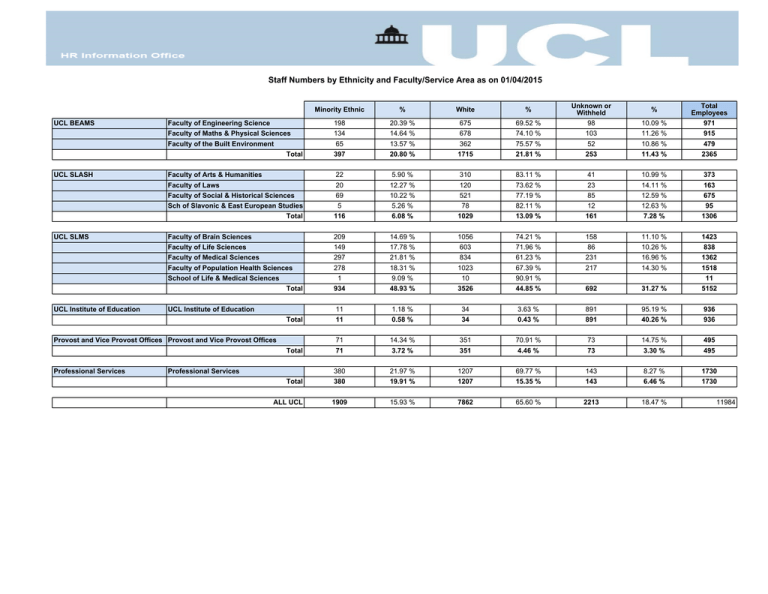
Staff Numbers by Ethnicity and Faculty/Service Area as on 01/04/2015 UCL BEAMS Faculty of Engineering Science Faculty of Maths & Physical Sciences Faculty of the Built Environment Total 198 134 65 397 20.39 % 14.64 % 13.57 % 20.80 % 675 678 362 1715 69.52 % 74.10 % 75.57 % 21.81 % Unknown or Withheld 98 103 52 253 UCL SLASH Faculty of Arts & Humanities Faculty of Laws Faculty of Social & Historical Sciences Sch of Slavonic & East European Studies Total 22 20 69 5 116 5.90 % 12.27 % 10.22 % 5.26 % 6.08 % 310 120 521 78 1029 83.11 % 73.62 % 77.19 % 82.11 % 13.09 % 41 23 85 12 161 10.99 % 14.11 % 12.59 % 12.63 % 7.28 % 373 163 675 95 1306 UCL SLMS Faculty of Brain Sciences Faculty of Life Sciences Faculty of Medical Sciences Faculty of Population Health Sciences School of Life & Medical Sciences Total 209 149 297 278 1 934 14.69 % 17.78 % 21.81 % 18.31 % 9.09 % 48.93 % 1056 603 834 1023 10 3526 74.21 % 71.96 % 61.23 % 67.39 % 90.91 % 44.85 % 158 86 231 217 11.10 % 10.26 % 16.96 % 14.30 % 692 31.27 % 1423 838 1362 1518 11 5152 UCL Institute of Education Total 11 11 1.18 % 0.58 % 34 34 3.63 % 0.43 % 891 891 95.19 % 40.26 % 936 936 Total 71 71 14.34 % 3.72 % 351 351 70.91 % 4.46 % 73 73 14.75 % 3.30 % 495 495 Total 380 380 21.97 % 19.91 % 1207 1207 69.77 % 15.35 % 143 143 8.27 % 6.46 % 1730 1730 ALL UCL 1909 15.93 % 7862 65.60 % 2213 18.47 % UCL Institute of Education Provost and Vice Provost Offices Provost and Vice Provost Offices Professional Services Professional Services Minority Ethnic % White % 10.09 % 11.26 % 10.86 % 11.43 % Total Employees 971 915 479 2365 % 11984

