Contextualizing NSSE Effect Sizes: Empirical Analysis and Interpretation of Benchmark Comparisons
advertisement
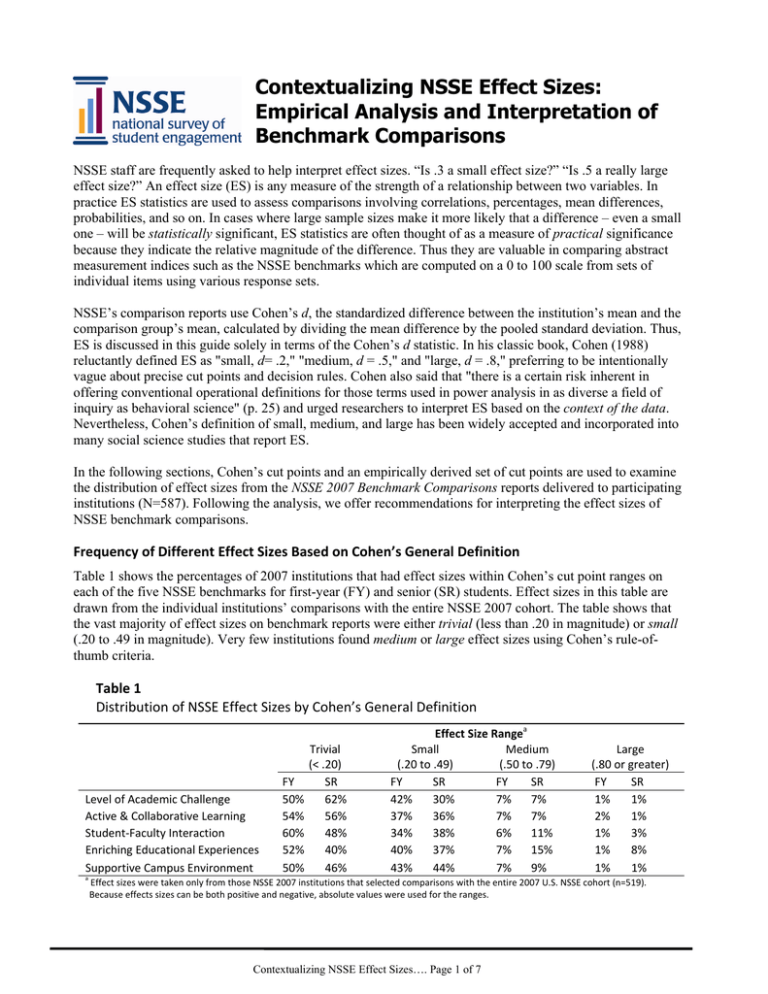
Contextualizing NSSE Effect Sizes: Empirical Analysis and Interpretation of Benchmark Comparisons NSSE staff are frequently asked to help interpret effect sizes. “Is .3 a small effect size?” “Is .5 a really large effect size?” An effect size (ES) is any measure of the strength of a relationship between two variables. In practice ES statistics are used to assess comparisons involving correlations, percentages, mean differences, probabilities, and so on. In cases where large sample sizes make it more likely that a difference – even a small one – will be statistically significant, ES statistics are often thought of as a measure of practical significance because they indicate the relative magnitude of the difference. Thus they are valuable in comparing abstract measurement indices such as the NSSE benchmarks which are computed on a 0 to 100 scale from sets of individual items using various response sets. NSSE’s comparison reports use Cohen’s d, the standardized difference between the institution’s mean and the comparison group’s mean, calculated by dividing the mean difference by the pooled standard deviation. Thus, ES is discussed in this guide solely in terms of the Cohen’s d statistic. In his classic book, Cohen (1988) reluctantly defined ES as "small, d= .2," "medium, d = .5," and "large, d = .8," preferring to be intentionally vague about precise cut points and decision rules. Cohen also said that "there is a certain risk inherent in offering conventional operational definitions for those terms used in power analysis in as diverse a field of inquiry as behavioral science" (p. 25) and urged researchers to interpret ES based on the context of the data. Nevertheless, Cohen’s definition of small, medium, and large has been widely accepted and incorporated into many social science studies that report ES. In the following sections, Cohen’s cut points and an empirically derived set of cut points are used to examine the distribution of effect sizes from the NSSE 2007 Benchmark Comparisons reports delivered to participating institutions (N=587). Following the analysis, we offer recommendations for interpreting the effect sizes of NSSE benchmark comparisons. Frequency of Different Effect Sizes Based on Cohen’s General Definition Table 1 shows the percentages of 2007 institutions that had effect sizes within Cohen’s cut point ranges on each of the five NSSE benchmarks for first-year (FY) and senior (SR) students. Effect sizes in this table are drawn from the individual institutions’ comparisons with the entire NSSE 2007 cohort. The table shows that the vast majority of effect sizes on benchmark reports were either trivial (less than .20 in magnitude) or small (.20 to .49 in magnitude). Very few institutions found medium or large effect sizes using Cohen’s rule-ofthumb criteria. Table 1 Distribution of NSSE Effect Sizes by Cohen’s General Definition Level of Academic Challenge Active & Collaborative Learning Student‐Faculty Interaction Enriching Educational Experiences Supportive Campus Environment a Trivial (< .20) FY SR 50% 62% 54% 56% 60% 48% 52% 40% 50% 46% Effect Size Rangea Small Medium (.20 to .49) (.50 to .79) FY SR FY SR 42% 30% 7% 7% 37% 36% 7% 7% 34% 38% 6% 11% 40% 37% 7% 15% 43% 44% 7% 9% Large (.80 or greater) FY SR 1% 1% 2% 1% 1% 3% 1% 8% 1% 1% Effect sizes were taken only from those NSSE 2007 institutions that selected comparisons with the entire 2007 U.S. NSSE cohort (n=519). Because effects sizes can be both positive and negative, absolute values were used for the ranges. Contextualizing NSSE Effect Sizes…. Page 1 of 7 Effect Size Interpretation Based on NSSE Data Cohen described small effects as those that are hardly visible, medium effects as observable and noticeable to the eye of the beholder, and large effects as plainly evident or obvious. With respect to this rationale, NSSE staff considered ways in which benchmark differences would be observable in the data, and proposed a scheme to interpret effect sizes based on the distribution of actual benchmark scores. To examine this alternative scheme, NSSE analysts assigned percentile rankings to institutions’ 2007 benchmark scores and used them to model comparisons that would resemble effect sizes of increasing magnitude (illustrated in Figures 1a – 1d). To explain, suppose that a small ES would resemble the difference between the benchmark scores of students attending institutions in the third quartile (i.e., between the 50th and 75th percentiles) and those attending institutions in the second quartile (i.e., between the 25th and 50th percentiles). These two sets of institutions are labeled groups A and B in Figure 1a. Because groups A and B are fairly close within the distribution, the difference between the students attending those institutions is expected to be small. In the same way, a medium ES (Figure 1b) would look like the difference between the benchmark scores of students attending institutions in the upper half (Group D) and those attending institutions in the lower half (Group C) of the distribution. A large ES (Figure 1c) would resemble the difference between students attending institutions scoring in the top quartile (Group F) and those attending institutions scoring in the bottom quartile (Group E) of the distribution. And finally, a very large ES (Figure 1d) would be like the difference between students attending institutions scoring in the lowest 10% (Group H) and highest 10% (Group G) of the distribution. Figures 1a‐ 1d Illustration of Four Model Comparison Groups for Determining Empirically‐Based Effect Size Thresholds Based on the Distribution of NSSE Benchmarks 1a. Small Group A 25% 1b. Medium Group B 25% Group C 50% Group D 50% Distribution of Institutional Benchmarks 1c. Large Distribution of Institutional Benchmarks Small ES ≈ ( xˉ b ‐ xˉ a)/SD Medium ES ≈ ( xˉ d ‐ xˉ c)/SD 1d. Very large Group E 25% Group F 25% Group G 10% Group H 10% Distribution of Institutional Benchmarks Large ES ≈ ( xˉ f ‐ xˉ e)/SD Distribution of Institutional Benchmarks Very large ES ≈ ( xˉ h ‐ xˉ g)/SD Note: x ˉ a through xˉ h are the mean benchmark scores of the students attending institutions within groups A through H. SD=Standard deviation (pooled). Contextualizing NSSE Effect Sizes…. Page 2 of 7 Below each figure is a formula for calculating the Cohen’s d effect size for the particular comparison being modeled in the illustration. For example, the formula under Figure 1a (Small ES ≈ ( x̄ b - x̄ a)/SD) conveys that a small ES is approximately the standardized difference between the mean benchmark score of students attending institutions in Group B (x̄ b) and the mean benchmark score of students attending institutions in Group A (x̄ a). Table 2 shows the effect sizes for these small, medium, large, and very large model comparisons for first-year students and seniors on all five NSSE benchmarks from 2007. While the effect sizes in Table 2 vary somewhat between benchmarks and between student class levels, the ranges within the small, medium, large, and very large categories are consistent and, with the exception of Enriching Educational Experiences for seniors, do not overlap. That is, the maximum small ES is lower than the minimum medium ES, the maximum medium ES is lower than the minimum large ES, and so on. Table 2 Effect Sizes from the NSSE Benchmark Percentile Group Comparisonsa First‐year Level of Academic Challenge Active & Collaborative Learning Student‐Faculty Interaction Enriching Educational Experiences Supportive Campus Environment Minimum Maximum a Smallb Medium Large 0.18 0.42 0.60 0.13 0.37 0.56 0.13 0.34 0.49 0.16 0.38 0.56 0.18 0.41 0.57 0.13 0.18 0.34 0.42 0.49 0.60 Seniors Very large 0.75 0.70 0.63 0.77 0.72 0.63 0.77 Small Medium Large 0.12 0.32 0.51 0.11 0.35 0.52 0.14 0.39 0.63 0.24 0.54 0.87 0.16 0.45 0.61 Very large 0.74 0.69 0.87 0.99 0.76 0.11 0.24 0.69 0.99 0.32 0.54 0.51 0.87 Only U.S. NSSE 2007 institutions were included in this analysis (n=587). Precision‐weighted means were used to determine the percentile ranking of each institution’s benchmark, separately for first‐year and senior students. b Small = ES difference between the scores of students attending institutions in the third quartile and those of students attending institutions in the second quartile on a particular benchmark. Medium = ES difference between the scores of students attending institutions in the upper half and those of students attending institutions in the lower half on a particular benchmark. Large = ES difference between the scores of students attending institutions in the top quartile and those of students attending institutions in the bottom quartile on a particular benchmark. Very large = ES difference between the scores of students attending institutions in the top 10% and those of students attending institutions in the bottom 10% on a particular benchmark. Tables 1 and 2 suggest that a slightly finer grained approach to effect size interpretation than Cohen’s is appropriate for NSSE benchmark comparisons. The consistency of ES values in Table 2 makes it possible to recommend new criteria for the interpretation of effect sizes in benchmark comparisons. Therefore, Table 3 proposes a new set of reference values for interpreting effect sizes, based on the results in Table 2. Like Cohen’s, these new values should not be interpreted as precise cut points, but rather are to be viewed as a coarse set of thresholds or minimum values by which one might consider the magnitude of an ES. These new reference values were selected after an examination of the minimum values in Table 2, which when rounded to the nearest tenth approximated evenly-spaced intervals between .1 and .7. The simplicity of the proposed values (.1, .3, .5, and .7) may have intuitive and functional appeal for users of NSSE data. Contextualizing NSSE Effect Sizes…. Page 3 of 7 Table 3 Proposed Reference Values for the Interpretation of Effect Sizes from NSSE Benchmark Comparisonsa Small Medium Large Very large a Effect size .1 .3 .5 .7 These values were based on NSSE benchmark distributions and are recommended for NSSE benchmark comparisons, not for individual item mean comparisons. Values are to be viewed as coarse thresholds, not as precise cut‐points. Table 4 reports the distribution of NSSE effect sizes based on these proposed reference values. As expected from our previous look at Table 1, the majority of effect sizes were trivial, small, and medium. Yet, this is a finer distribution within categories from what we saw in Table 1 based on Cohen’s definitions. In Table 4 approximately one-quarter to one-third of all effect sizes appear to be in the trivial range, more than 40% are considered small, and the new medium range captures about a 20 to 25% of all effect sizes. Large and very large effect sizes are relatively rare. Table 4 Distribution of NSSE 2007 Effect Sizes by the Proposed Reference Values Effect Size Rangea Trivial (0 to .09) Benchmark FY Level of Academic Challenge Active & Collaborative Learning Student‐Faculty Interaction Enriching Educational Experiences Supportive Campus Environment 27% 29% 34% 25% 27% SR 34% 29% 25% 21% 23% Small (.10 to .29) FY 43% 44% 45% 46% 41% SR 44% 46% 40% 32% 42% Medium (.30 to .49) FY 22% 18% 15% 22% 24% SR 14% 17% 20% 24% 25% Large (.50 to .69) FY 6% 6% 5% 5% 7% SR 5% 6% 9% 11% 7% Very Large (.70 or more) FY 2% 3% 2% 2% 1% SR 3% 2% 5% 11% 3% a Effect sizes were taken only from those institutions that selected comparisons with all 2007 U.S. institutions (n=519). Because effects sizes are both positive and negative, absolute values were used for the ranges. Case Study – “Sample University” The following provides an example of how information provided in this guide can be applied to real results. Sample University (SU) endeavors to be one of the most engaging institutions in the US, with a challenging and enriching academic experience, active and collaborative students, an open and helpful faculty, and the most supportive infrastructure possible for student learning. After work over several years on several initiatives, the provost asked the director of institutional research to give a progress report based on the latest NSSE results. Table 5 shows the five benchmark scores for seniors attending Sample University alongside scores for the selected comparison group. The third column lists the effect sizes for the mean comparisons. Of course SU is pleased with these results. Indeed, three of the five benchmarks are substantially positive and affirming of their goals. The director of institutional research noticed that the Level of Academic Challenge at SU is in fact quite strong, with a “very large” effect at .72. Active and Collaborative Learning and Supportive Campus Environment are also well above average with “medium” effects of .44 Contextualizing NSSE Effect Sizes…. Page 4 of 7 and .30 respectively. The effect size for Enriching Educational Experiences is also on the positive side, but perhaps “small” in magnitude at .23. The only benchmark showing perhaps no meaningful or practical difference is Student-Faculty Interaction at .08. Table 5 Sample University Benchmark Comparisonsa (Seniors) Benchmark Level of Academic Challenge Active and Collaborative Learning Student‐Faculty Interaction Enriching Educational Experiences Supportive Campus Environment a Benchmark Scores Selected Sample comparison University group 65.8 55.6 57.7 50.1 42.8 41.2 44.0 39.8 62.7 56.9 Effect size .72 Very large .44 Medium .08 Trivial .23 Small .30 Medium These results are taken from an actual institution, yet we acknowledge that they are unusually positive. They were intentionally selected for the illustrative purposes of this manuscript. Although the recommended definitions in the ES chart in Table 3 are useful in interpreting the comparison results, more actionable observations often exist at the item level. Item frequencies can make benchmark scores and effect sizes more tangible and observable. For example, Table 6 reports Sample University’s frequencies for the individual items corresponding to the benchmark scores in Table 5. The response options for all the items were collapsed for quick review and interpretation. Both SU and the selected comparison group percentages are given, with the percentage differences listed in the right hand column. With the exception of items associated with Student-Faculty Interaction, nearly all show positive differences when compared with the selected comparison group. A series of small differences can accumulate into appreciable effect sizes when combined to form the benchmark score. Among the Level of Academic Challenge items, several large percentage differences stand out for Sample University. For example, 36% more SU students said they read 10 or more assigned books and 27% more wrote at least four mid-length papers. SU seniors also reported that their coursework emphasized substantially more analysis, synthesis, evaluation, and application. These differences in the individual item responses account for the very large effect size of .72 on this benchmark. The medium Active and Collaborative Learning effect size of .44 is also evident in the individual item frequencies. For example, compared to seniors attending the selected comparison group institutions, 21% more SU seniors contributed to class discussions frequently (often or very often), and 17% more made class presentations frequently. Likewise, the medium effect on the Supportive Campus Environment benchmark is evident in the mostly positive response differences on the individual items, ranging up to 14%. The small magnitude of the Enriching Educational Experiences benchmark is due to mixed results among the items, with those showing positive differences for SU (such as foreign language coursework, internships, and co-curricular activities) to some extent offset by those showing negative differences for SU (such as independent studies and culminating senior experiences). Other items show only modest differences. Still, the net result is a positive effect size of .23. Contextualizing NSSE Effect Sizes…. Page 5 of 7 Table 6 Sample University Item Frequencies by Benchmark (Seniors) Item # Percent of students who... Sample University Selected Comparison Group Differ‐ ence 82% 66% 95% 90% 86% 95% 68% 62% 72% 37% 69% 78% 57% 84% 74% 71% 79% 32% 49% 46% 31% 55% 4% 10% 11% 16% 15% 16% 36% 12% 27% 6% 14% 90% 76% 45% 69% 30% 27% 64% 69% 59% 47% 58% 22% 17% 62% 21% 17% ‐2% 11% 8% 10% 1% 57% 47% 27% 64% 22% 19% 58% 40% 27% 62% 21% 19% ‐1% 6% 0% 1% 1% 0% 49% 59% 53% 62% 65% 68% 27% 61% 23% 11% 23% 37% 46% 60% 53% 55% 53% 59% 25% 41% 14% 18% 32% 24% 3% ‐1% 0% 7% 12% 9% 1% 20% 9% ‐6% ‐9% 13% 82% 30% 40% 77% 87% 64% 68% 24% 34% 82% 78% 53% 14% 6% 6% ‐4% 9% 11% Level of Academic Challenge (ES=.72) 10a. 1r. 2b. 2c. 2d. 2e. 3a. 3c. 3d. 3e. 9a. Said the institution emphasizes studying and academic work3 Worked harder than you expected to meet an instructor's expectations1 Said courses emphasized analyzing ideas, experiences, or theories3 3 Said courses emphasized synthesizing ideas into new complex relationships 3 Said courses emphasized making judgments about the value of information Said courses emphasized applying theories or concepts to new situations3 Read more than 10 assigned books or book‐length packs of readings Wrote at least one paper or report of 20 pages or more Wrote more than 4 papers or reports between 5 and 19 pages Wrote more than 10 papers or reports of fewer than 5 pages Spent more than 10 hours/week preparing for class (studying, etc.) Active and Collaborative Learning (ES=.44) 1a. 1b. 1g. 1h. 1j. 1k. 1t. Asked questions/contributed to class discussions1 Made a class presentation1 Worked with other students on projects during class1 Worked with classmates outside of class to prepare class assignments1 Tutored or taught other students (paid or voluntary)1 Did a community‐based project as part of a regular course1 1 Discussed ideas from readings or classes with others outside of class Student‐Faculty Interaction (ES=.08) 1n. 1o. 1p. 1q. 1s. 7d. Discussed grades or assignments with an instructor1 Talked about career plans with a faculty member or advisor1 Discussed ideas from classes with faculty outside of class1 Received prompt written or oral feedback from faculty1 Worked with faculty members on activities other than coursework1 Worked on a research project with a faculty member outside of class Enriching Educational Experiences (ES=.23) 10c. 1l. 1u. 1v. 7a. 7b. 7c. 7e. 7f. 7g. 7h. 9d. Said the institution substantially encourages contacts among diverse peers3 Used an electronic medium to discuss or complete an assignment1 1 Had serious conversations w/ students of another race or ethnicity Had serious conversations w/ students of other relig./politics/values1 Did a practicum, internship, field exp., clinical assgmt Participated in community service or volunteer work Participated in a learning community Completed foreign language coursework Completed a study abroad program Participated in an independent study or self‐designed major Completed a culminating senior experience Spent more than 5 hours/week participating in co‐curricular activities Supportive Campus Environment (ES=.30) 10b. 10d. 10e. 8a. 8b. 8c. Said the institution provides substantial support for academic success3 3 Said the institution substantially helps students cope w/ non‐acad. matters Said the institution provides substantial support for students' social needs3 Positively rated their relationships with other students2 Positively rated their relationships with faculty members2 Positively rated their relationships with admin. personnel and offices2 1 Combination of students responding 'very often' or 'often' Rated at least 5 on a 7‐point scale 3 Combination of students responding 'very much' or 'quite a bit' 2 Contextualizing NSSE Effect Sizes…. Page 6 of 7 Finally, Student-Faculty Interaction shows a trivial effect for SU in comparison with the selected comparison group, which is plainly evident by the meager percentage differences between the two groups. Taken together, the differences between Sample University and the comparison group in these item frequencies provide a rich explanation for the effect sizes seen in Table 5. Observations like this can help administrators and policy makers cultivate specific action plans to improve the undergraduate experience. Conclusion The purpose of this study was to analyze effect sizes in the context of actual NSSE data and to guide the interpretation of the effect sizes on NSSE’s Benchmark Comparisons reports. These analyses informed the development of a new set of reference values for interpreting the benchmark effect sizes. As a practical matter for NSSE users, at least four approaches can be taken with regard to effect sizes. 1. First, it’s not unreasonable to continue using Cohen’s purposefully vague definition. The new reference values offered in Table 3 only deviate from Cohen in the lower values. Some may be convinced that small effect sizes are unworthy of further examination, and thus should continue to look for values around .5 and greater. 2. Second, for those willing to consider the new reference values proposed in Table 3, the thresholds of .1, .3, .5, and .7 could have appeal for their simplicity and functionality. They are grounded in actual NSSE findings and may allow for richer interpretations of NSSE results. 3. Third, it’s also possible to ignore the new reference values and to examine the results in Table 2 for a more nuanced interpretation of a particular ES. Table 2 reveals a different pattern of effect sizes for each benchmark, and also that these differ between first-year students and seniors. What’s more, effect sizes for the Enriching Educational Experiences benchmark for seniors tend to be larger in magnitude than for other benchmarks. 4. Finally, the guide also recommends an examination of individual item frequencies in combination with ES interpretation. Individual items provide a richer explanation for the magnitude of the effect sizes, and can help administrators and policy makers interpret results in ways that are context-specific and actionable. Be aware that many combinations of individual item results can produce a particular ES. For example, consider two institutions with the same ES on a particular benchmark. The first may have large percentage differences on just a few of the benchmark items and no differences on the others, while the second could have small percentage differences on all the items. Whatever the approach, effect sizes can be a useful statistic to help institutions interpret the strength or magnitude of their benchmark scores in relation to their selected comparison groups. References Cohen, J. (1988). Statistical power analysis for the behavioral sciences (2nd ed.). Hillsdale, NJ: Lawrence Erlbaum Associates. Indiana University Center for Postsecondary Research 1900 East Tenth Street, Suite 419 Bloomington, IN 47406-7512 Phone: 812-856-5824 Fax: 812-856-5150 E-mail: nsse@indiana.edu Web: www.nsse.iub.edu Contextualizing NSSE Effect Sizes…. Page 7 of 7
