Now You See It ... The Visual Factory; Making Operational...
advertisement
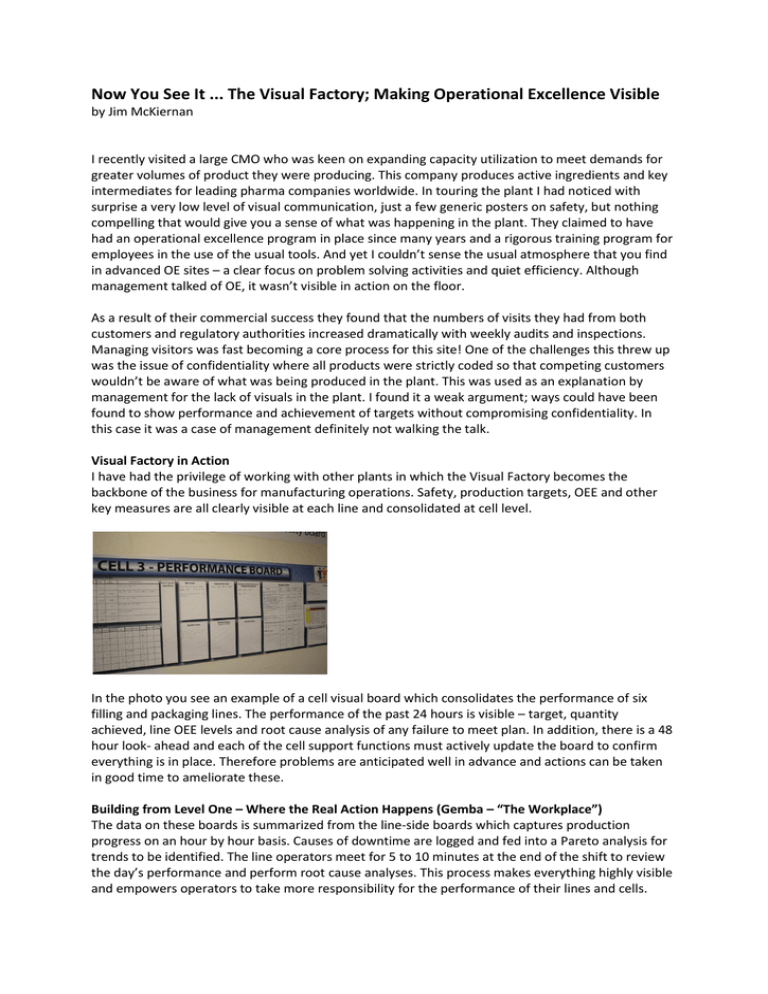
Now You See It ... The Visual Factory; Making Operational Excellence Visible by Jim McKiernan I recently visited a large CMO who was keen on expanding capacity utilization to meet demands for greater volumes of product they were producing. This company produces active ingredients and key intermediates for leading pharma companies worldwide. In touring the plant I had noticed with surprise a very low level of visual communication, just a few generic posters on safety, but nothing compelling that would give you a sense of what was happening in the plant. They claimed to have had an operational excellence program in place since many years and a rigorous training program for employees in the use of the usual tools. And yet I couldn’t sense the usual atmosphere that you find in advanced OE sites – a clear focus on problem solving activities and quiet efficiency. Although management talked of OE, it wasn’t visible in action on the floor. As a result of their commercial success they found that the numbers of visits they had from both customers and regulatory authorities increased dramatically with weekly audits and inspections. Managing visitors was fast becoming a core process for this site! One of the challenges this threw up was the issue of confidentiality where all products were strictly coded so that competing customers wouldn’t be aware of what was being produced in the plant. This was used as an explanation by management for the lack of visuals in the plant. I found it a weak argument; ways could have been found to show performance and achievement of targets without compromising confidentiality. In this case it was a case of management definitely not walking the talk. Visual Factory in Action I have had the privilege of working with other plants in which the Visual Factory becomes the backbone of the business for manufacturing operations. Safety, production targets, OEE and other key measures are all clearly visible at each line and consolidated at cell level. In the photo you see an example of a cell visual board which consolidates the performance of six filling and packaging lines. The performance of the past 24 hours is visible – target, quantity achieved, line OEE levels and root cause analysis of any failure to meet plan. In addition, there is a 48 hour look- ahead and each of the cell support functions must actively update the board to confirm everything is in place. Therefore problems are anticipated well in advance and actions can be taken in good time to ameliorate these. Building from Level One – Where the Real Action Happens (Gemba – “The Workplace”) The data on these boards is summarized from the line-side boards which captures production progress on an hour by hour basis. Causes of downtime are logged and fed into a Pareto analysis for trends to be identified. The line operators meet for 5 to 10 minutes at the end of the shift to review the day’s performance and perform root cause analyses. This process makes everything highly visible and empowers operators to take more responsibility for the performance of their lines and cells. Creating a New Management Culture There is a third level of performance review above lines and cells and this occurs at management level. A daily management review takes place at an “Accountability Board” in which issues that cannot be resolved at line or cell level are escalated up. These meetings are sharp and focused, taking no more than 15 to 20 minutes. Managers are encouraged to respond quickly to issues and accountabilities are assigned for follow-up by the entire team within days of the action being identified. There is now no hiding place and the focus is exactly where it belongs – everybody on a production site is there to produce or to support those who do so. Visual management is creating a whole new culture in which teamwork becomes key to success and management needs to become more visible itself – at Gemba, where the real action happens, not in the Boardroom!
