Varying temporal scale of climate control of flowering
advertisement
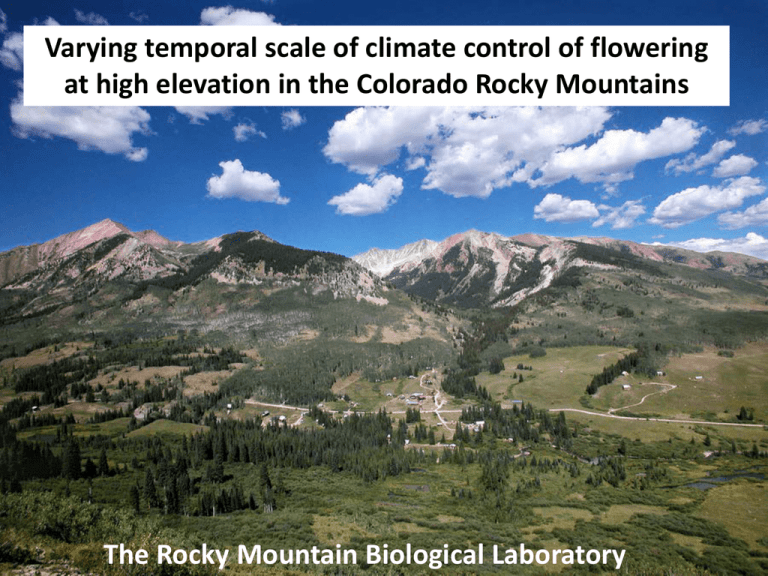
Varying temporal scale of climate control of flowering at high elevation in the Colorado Rocky Mountains The Rocky Mountain Biological Laboratory Mean snowfall (since 1975) = 10.9 m Range = 4.7 – 16.4 m 1800 Winter Snowfall in Gothic 1600 Snowfall (cm) 1400 1200 1000 800 600 400 200 0 1975 1980 1985 1990 1995 2000 2005 2010 Mean minimum April temperature (°F) 26 24 22 20 18 16 14 12 10 r2 = .178, p = .007 8 1975 1980 1985 1990 1995 2000 2005 2010 Was also forecast for: Montrose, CO Grand Junction, CO Gunnison, CO Aspen, CO Telluride, CO Rifle, CO Cahone, CO Dove Creek, CO Cisco, UT Thompson, UT Moab, UT Bluff, UT Mexican Water, AZ First Date of Bare Ground (Day of Year) 180 Gothic Snow Data (from billy barr) 6/19/95 170 160 150 140 130 120 110 4/26/77 1975 1980 4/25/02 1985 1990 1995 2000 2005 4/23/12 2010 2015 Day of year of peak flow, East River at Almont 29 June 180 170 160 150 140 130 7 May 120 1940 1960 1980 2000 170 Mean day of year of first flower r2 = .681 p < .001 Claytonia lanceolata 14 June 160 150 140 130 120 24 April 110 20 April 110 120 130 140 150 Day of year of bare ground 160 170 19 June 200 Date of first flower 190 180 170 160 Cardamine cordifolia 150 140 1970 1980 1990 2000 2010 Number of flowers and plants in bloom 30 Summer rain can produce a second flowering period Androsace septentrionalis, plot WM5, 1997 25 20 15 10 5 0 6/16 Date vs. Flowers Date vs. Plants 6/30 7/14 7/28 Date 8/11 8/25 Frasera speciosa (Gentianaceae) Frasera speciosa (Gentianaceae) being visited by Bombus flavifrons. Cumberland Pass, 12,300 ft. 1982 1983 1984 1985 1986 1987 1988 1989 1990 1991 Rec. G G 2 2 2 2 2 2 2 1992 1993 1994 1995 1996 1997 1998 1999 2000 2001 2 2 2 2 2 2 2 2 2 2 2002 2003 2004 2005 2006 2007 2008 2009 2010 2011 2 4 2 2 2 2 2 2 2 2 2012 2013 2014 2015 2016 2017 ? 4 2018 2019 2020 2021 The history of Frasera plant #911 Frasera plant #911 in 2011; a seedling in 1982 Frasera speciosa flowering in the East River Valley 18000 Number of flowering plants 16000 14000 12000 10000 ? ? ? 8000 6000 4000 2000 0 1970 1980 1990 2000 2010 What triggers the mast flowering events in Frasera speciosa? Frasera speciosa flowering in East River valley N = 8 years with > 1,700 flower stalks (1980-2010) 0.8 r 2 0.6 0.4 0.2 0.0 0 1 2 3 4 5 6 Number of years lag for precipitation before mast flowering 7 East River valley Frasera speciosa Number of flowering plants 20000 2 r = .747 P < .003 18000 16000 14000 1961 1969 12000 10000 1973 8000 1951 6000 4000 1977 2000 0 4 6 8 10 12 14 16 July + August precipitation 4 years previous (cm) 18 Where else did Frasera speciosa flower in 2010? Wasatch Mountains in Utah (Tony Frates, Jonathan Coop, Zak Gezon, and Wayne Padgett, pers. comm.) San Pitch Mountains in Utah (Matthew Meccariello, pers. comm.) Colorado Plateau in southern Utah (Ben Everitt, pers. comm.) Sandia Mountains in New Mexico (Dana M. Price, George Miller, and Vera Norwood, pers. comm.) Lemhi Mountain Range in Idaho (Wendy Jo Hoffman, pers. comm.) San Juan Mountains in Colorado (Al Schneider, Amanda Kuenzi, Steve Traudt, Joe Ceredini, and Priscilla Sherman, pers. comm.) East River valley Frasera flowering Years with > 1,000 flower stalks 20000 r2 = .747, p = .003 Number of flowering plants 18000 1996 2010 1988 16000 14000 1969 1961 12000 10000 2003 2005 1990 2014 8000 1973 1980 2016 6000 4000 1977 2000 1983 1992 0 6 8 10 12 14 16 July + August rain, four years before flowering (cm) 18 East River valley Frasera flowering Years with > 1,000 flower stalks 20000 r2 = .717, p = .004 Number of flowering plants 18000 1996 2010 1988 16000 14000 1969 1961 12000 10000 2003 2005 1990 2014 8000 1973 1980 2016 6000 4000 1977 2014 2000 1983 1992 0 6 8 10 12 14 16 July + August rain, four years before flowering (cm) 18 Polygonum viviparum Veratrum tenuipetalum (Melanthiaceae) Ramets flowering (of 1,000 counted) Is there an environmental cue that triggers Veratrum flowering? 600 500 East side plot 400 West side plot 300 * = watered 200 100 0 1985 1990 1995 * * 2000 2005 2010 Yes! A cool summer: mean 49.8° in June 2009 (mean = 51.3°) mean 56.5° in July 2009 (mean = 57.0°) Wait another year for preformation: 2010 Then a flowering year: 2011 Is there an effect of climate change? Environmental conditions were conducive to flowering in 21.6% of the years from 1928-1983 compared to 14.8% from 1984 to 2010. Helianthella quinquenervis 13 June 2001 21.55 (F) -5.81 (C) 11 June 2004 25.07° F, -3.9° C Number of aspen sunflower heads 3500 lower plot upper plot 3000 2500 2000 1500 1000 500 0 1976 1980 1984 1988 1992 1996 2000 2004 2008 2012 6-year running segments Peak flow in East River at Almont (cfs) 4000 3500 3000 2500 2000 1500 1000 500 0 1940 1950 1960 1970 1980 1990 2000 2010 Peak flow in East River at Almont (cfs) 6000 5000 4000 3000 2000 1000 0 1940 1950 1960 1970 1980 1990 2000 2010 Evolution of decadal and multidecadal signals in precipitation (thick lines) in (a) northern California (winter), (b) the central Rocky Mountains (autumn), (c) Minnesota (winter), and (d) eastern Québec (annual). The thin lines illustrate the original seasonal precipitation record for each region. The decadal component of autumn precipitation over the central Rocky Mountains operates on a 12–14-yr time scale. Over the last 40 yr, this component has been roughly in phase with the northern California pattern but this correspondence was not present before 1960. Ault & St. George 2010 Delphinium nuttallianum - 8 yr intervals Mean day of year of first flower 190 180 170 160 150 140 130 1975 1980 1985 1990 1995 2000 2005 2010 7-year running intervals, Delphinium nuttallianum Peak number of flowers 1000 800 600 400 200 0 1970 1975 1980 1985 1990 1995 2000 2005 2010 This summer – radio transmitters on hummingbirds Conclusions • Mountain environment is highly variable and changing • Snowmelt dates are earlier, but frost dates are not • Climate effects on phenology are driven almost entirely by snowmelt date • Flowering abundance can be driven by climate effects with no lag, 2-year lag, or 4-year lag • Unknown climate drivers are generating decadal cycles, necessitating decades-long studies to study their effects
