Probability Plot
advertisement
Probability Plot
Example:
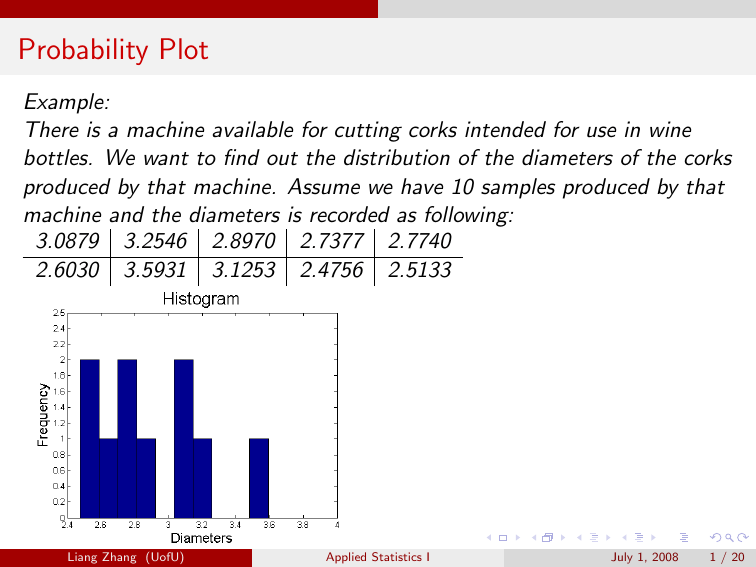
There is a machine available for cutting corks intended for use in wine
bottles. We want to find out the distribution of the diameters of the corks
produced by that machine. Assume we have 10 samples produced by that
machine and the diameters is recorded as following:
3.0879 3.2546 2.8970 2.7377 2.7740
2.6030 3.5931 3.1253 2.4756 2.5133
Liang Zhang (UofU)
Applied Statistics I
July 1, 2008
1 / 20
Probability Plot
3.0879
2.6030
3.2546
3.5931
Liang Zhang (UofU)
2.8970
3.1253
2.7377
2.4756
2.7740
2.5133
Applied Statistics I
July 1, 2008
2 / 20
Probability Plot
Sample Percentile
Recall: The (100p)th percentile of the distribution of a continuous rv X ,
R η(p)
denoted by η(p), is defined by p = F (η(p)) = −∞ f (y )dy .
In words, the (100p)th percentile η(p) is the X value such that there are
100p% X values below η(p).
Similarly, we can define sample percentile in the same manner, i.e. the
(100p)th percentile xp is the value such that there are 100p% sample
values below xp .
Unfortunately, xp may not be a sample value for some p.
e.g. for the previous example, what is the 35th percentile for the ten
sample values?
Liang Zhang (UofU)
Applied Statistics I
July 1, 2008
3 / 20
Probability Plot
Definition
Assume we have a sample with size n. Order the n sample observations
from smallest to largest. Then the ith smallest observation in the list is
taken to be the [100(i − 0.5)/n]th sample percentile.
Remark:
1. Why “i − 0.5”? We regard the sample observation as being half in the
lower group and half in the upper group.
e.g. if n = 9, then the sample median is the 5th largest observation and
this observation is regarded as two parts: one in the lower half and one in
the upper half.
2. Once the percentage values 100(i − 0.5)/n(i = 1, 2, . . . , n) have been
calculated, sample percentiles corresponding to intermediate percentages
can be obtained by linear interpolation.
Liang Zhang (UofU)
Applied Statistics I
July 1, 2008
4 / 20
Probability Plot
Example: for the previous example, the [100(i − 0.5)/n]th sample
percentile is tabulated as following:
2.4756
2.5133
2.6030
100(1-.5)/10 = 5%
100(2-.5)/10 = 15% 100(3-.5)/10 = 25%
2.7377
2.7740
100(4-.5)/10 = 35% 100(5-.5)/10 = 45%
2.8970
3.0879
3.1253
100(6-.5)/10 = 55% 100(7-.5)/10 = 65% 100(8-.5)/10 = 75%
3.2546
3.5931
100(9-.5)/10 = 85% 100(10-.5)/10 = 95%
The 10th percentile would be (2.4756 + 2.5133)/2 = 2.49445
Liang Zhang (UofU)
Applied Statistics I
July 1, 2008
5 / 20
Probability Plot
Idea for Quantile-Quantile Plot:
1. Determine the “[100(i − 0.5)/n]th sample percentile” for a given
sample.
2. Find the corresponding [100(i − 0.5)/n]th percentile from the
population with the assumed distribution; for example, if the assumed
distribution is standard normal, then find corresponding
[100(i − 0.5)/n]th percentile from the standard normal distribution.
3. Consider the (population percentile, sample percentile) pairs, i.e.
[100(i − 0.5)/n]th percentile, ith smallest sample
of the distribution
observation
4. Each pair plotted as a point on a two-dimensional coordinate system
should fall close to a 45◦ line. Substantial deviations of the plotted
points from a 45◦ line cast doubt on the assumption that the
distribution under consideration is the correct one.
Liang Zhang (UofU)
Applied Statistics I
July 1, 2008
6 / 20
Probability Plot
Example 4.29:
The value of a certain physical constant is known to an experimenter. The
experimenter makes n = 10 independent measurements of this value using
a particular measurement device and records the resulting measurement
errors (error = observed value - true value). These observations appear in
the following table.
Percentage
Sample Observation
Percentage
Sample Observation
5
-1.91
55
0.35
15
-1.25
65
0.72
25
-0.75
75
0.87
35
-0.53
85
1.40
45
0.20
95
1.56
Is it plausible that the random variable measurement error has standard
normal distribution?
Liang Zhang (UofU)
Applied Statistics I
July 1, 2008
7 / 20
Probability Plot
We first find the corresponding
case, the z percentiles:
Percentage
5
Sample Observation -1.91
z percentile
-1.645
Percentage
55
Sample Observation
0.35
z percentile
0.126
Liang Zhang (UofU)
population distribution percentiles, in this
15
-1.25
-1.037
65
0.72
0.385
25
-0.75
-0.675
75
0.87
0.675
Applied Statistics I
35
-0.53
-0.385
85
1.40
1.037
45
0.20
-0.126
95
1.56
1.645
July 1, 2008
8 / 20
Probability Plot
Liang Zhang (UofU)
Applied Statistics I
July 1, 2008
9 / 20
Probability Plot
What about the first example? We are only interested in whether the ten
sample observations come from a normal distribution.
Recall:
{(100p)th percentile for N(µ, σ 2 )} =
µ + {(100p)th percentile for N(0, 1)} · σ
If µ = 0, then the pairs (σ · [z percentile], observation) fall on a 45◦ line,
which has slope 1.
Therefore the pairs ([z percentile], observation) fall on a line passing
through (0,0) (i.e., one with y -intercept 0) but having slope σ rather than
1.
Now for µ 6= 0, the y -intercept is µ instead of 0.
Liang Zhang (UofU)
Applied Statistics I
July 1, 2008
10 / 20
Probability Plot
Normal Probability Plot
A plot of the n pairs
([100(i − 0.5)/n]th z percentile, ith smallest observation)
on a two-dimensional coordinate system is called a normal probability
plot. If the sample observations are in fact drawn from a normal
distribution with mean value µ and standard deviation σ, the points should
fall close to a straight line with slope σ and y -intercept µ. Thus a plot for
which the points fall close to some straight line suggests that the
assumption of a normal population distribution is plausible.
Liang Zhang (UofU)
Applied Statistics I
July 1, 2008
11 / 20
Probability Plot
First Example:
Percentage
Sample Observation
z percentile
Percentage
Sample Observation
z percentile
Liang Zhang (UofU)
5
2.4756
-1.645
55
2.8970
0.126
15
2.5133
-1.037
65
3.0879
0.385
25
2.6030
-0.675
75
3.1253
0.675
Applied Statistics I
35
2.7377
-0.385
85
3.2546
1.037
45
2.7740
-0.126
95
3.5931
1.645
July 1, 2008
12 / 20
Probability Plot
A nonnormal population distribution can often be placed in one of the
following three categories:
1. It is symmetric and has “lighter tails” than does a normal
distribution; that is, the density curve declines more rapidly out in the
tails than does a normal curve.
2. It is symmetric and heavy-tailed compared to a normal distribution.
3. It is skewed.
Liang Zhang (UofU)
Applied Statistics I
July 1, 2008
13 / 20
Probability Plot
Symmetric and “light-tailed”: e.g. Uniform distribution
Liang Zhang (UofU)
Applied Statistics I
July 1, 2008
14 / 20
Probability Plot
Symmetric and heavy-tailed: e.g. Cauchy distribution with pdf
f (x) = 1/[π(1 + x 2 )] for −∞ < x < ∞
Liang Zhang (UofU)
Applied Statistics I
July 1, 2008
15 / 20
Probability Plot
Skewed: e.g. lognormal distribution
Liang Zhang (UofU)
Applied Statistics I
July 1, 2008
16 / 20
Probability Plot
Some guidances for probability plot for normal distributions
(from the book Fitting Equations to Data (2nd ed.) Daniel, Cuthbert,
and Fed Wood, Wiley, New York, 1980)
1. For sample size smaller than 30, there is typically greater variation in
the apperance of the probability plot.
2. Only for much larger sample sizes does a linear pattern generally
predominate.
Therefore, when a plot is based on a small sample size, only a very
substantial departure from linearity should be taken as conclusive evidence
of nonnorality.
Liang Zhang (UofU)
Applied Statistics I
July 1, 2008
17 / 20
Probability Plot
Definition
Consider a family of probability distributions involving two parameters, θ1
and θ2 , and let F (x; θ1 , θ2 ) denote the corresponding cdf’s.
The parameters θ1 and θ2 are said to be location and scale parameters,
respectively, if F (x; θ1 , θ2 ) is a function of (x − θ1 )/θ2 .
e.g.
1. Normal distributions N(µ, σ): F (x; µ, σ) = Φ( x−µ
σ ).
2. The extreme value distribution with cdf
F (x; θ1 , θ2 ) = 1 − e −e
Liang Zhang (UofU)
Applied Statistics I
(x−θ1 )/θ2
July 1, 2008
18 / 20
Probability Plot
For Weibull distribution:
α
F (x; α, β) = 1 − e −(x/β) ,
the parameter β is a scale parameter but α is NOT a location parameter.
α is usually referred to as a shape parameter.
Fortunately, if X has a Weibull distribution with shape parameter α and
scale parameter β, then the transformed variable ln(X ) has an extreme
value distribution with location parameter θ1 = ln(β) and scale parameter
θ2 = 1/α.
Liang Zhang (UofU)
Applied Statistics I
July 1, 2008
19 / 20
Probability Plot
The gamma distribution also has a shape parameter α. However, there is
no transformation h(•) such that h(X ) has a distribution that depends
only on location and scale parameters.
Thus, before we construct a probability plot, we have to estimate the
shape parameter from the sample data.
Liang Zhang (UofU)
Applied Statistics I
July 1, 2008
20 / 20
