The University of Montana Planning Assumptions ‐ Initial Fiscal Year 2016/2017 Updated May 29, 2015
advertisement
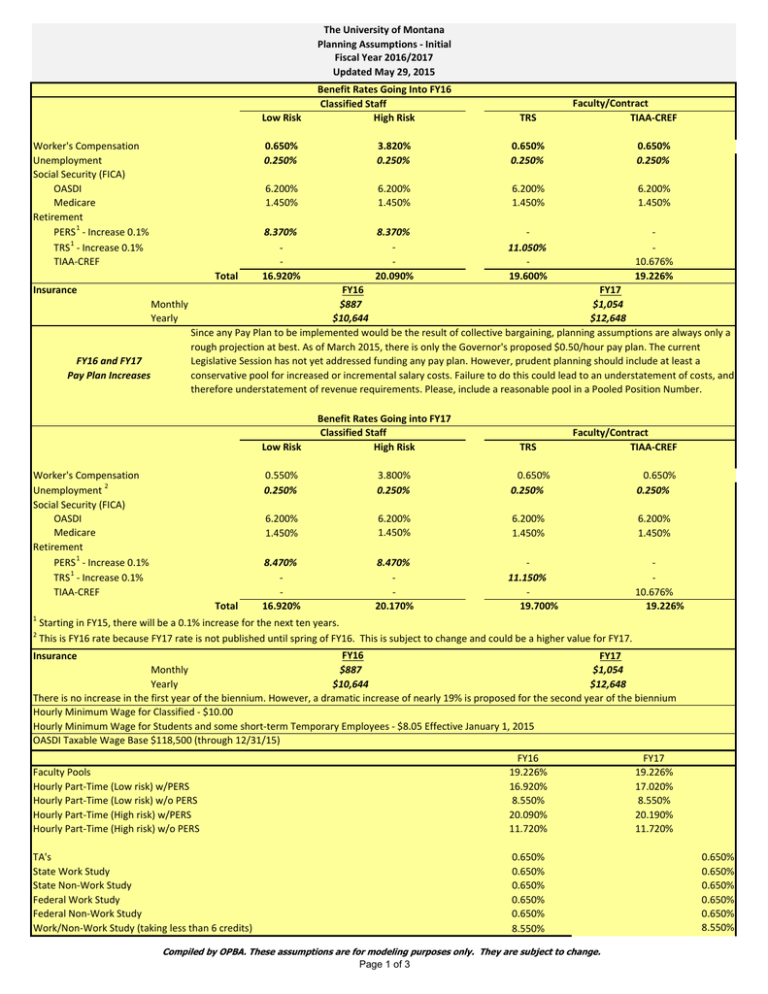
The University of Montana Planning Assumptions ‐ Initial Fiscal Year 2016/2017 Updated May 29, 2015 Low Risk Worker's Compensation Unemployment Social Security (FICA) OASDI Medicare Retirement 1 PERS ‐ Increase 0.1% 1 TRS ‐ Increase 0.1% TIAA‐CREF Total Insurance Monthly Yearly FY16 and FY17 Pay Plan Increases Benefit Rates Going Into FY16 Classified Staff High Risk TRS Faculty/Contract TIAA‐CREF 0.650% 0.250% 3.820% 0.250% 0.650% 0.250% 0.650% 0.250% 6.200% 1.450% 6.200% 1.450% 6.200% 1.450% 6.200% 1.450% 8.370% ‐ ‐ 16.920% 8.370% ‐ ‐ 20.090% ‐ 11.050% ‐ 19.600% ‐ ‐ 10.676% 19.226% FY17 FY16 $887 $1,054 $10,644 $12,648 Since any Pay Plan to be implemented would be the result of collective bargaining, planning assumptions are always only a rough projection at best. As of March 2015, there is only the Governor's proposed $0.50/hour pay plan. The current Legislative Session has not yet addressed funding any pay plan. However, prudent planning should include at least a conservative pool for increased or incremental salary costs. Failure to do this could lead to an understatement of costs, and therefore understatement of revenue requirements. Please, include a reasonable pool in a Pooled Position Number. Low Risk Worker's Compensation 2 Unemployment Social Security (FICA) OASDI Medicare Retirement PERS 1 ‐ Increase 0.1% 1 TRS ‐ Increase 0.1% TIAA‐CREF Total Benefit Rates Going into FY17 Classified Staff High Risk TRS Faculty/Contract TIAA‐CREF 0.550% 0.250% 3.800% 0.250% 0.650% 0.250% 0.650% 0.250% 6.200% 1.450% 6.200% 1.450% 6.200% 1.450% 6.200% 1.450% 8.470% ‐ ‐ 16.920% 8.470% ‐ ‐ 20.170% ‐ 11.150% ‐ 19.700% ‐ ‐ 10.676% 19.226% 1 Starting in FY15, there will be a 0.1% increase for the next ten years. 2 This is FY16 rate because FY17 rate is not published until spring of FY16. This is subject to change and could be a higher value for FY17. FY16 FY17 $887 $1,054 Monthly $10,644 $12,648 Yearly There is no increase in the first year of the biennium. However, a dramatic increase of nearly 19% is proposed for the second year of the biennium Hourly Minimum Wage for Classified ‐ $10.00 Hourly Minimum Wage for Students and some short‐term Temporary Employees ‐ $8.05 Effective January 1, 2015 OASDI Taxable Wage Base $118,500 (through 12/31/15) Insurance Faculty Pools Hourly Part‐Time (Low risk) w/PERS Hourly Part‐Time (Low risk) w/o PERS Hourly Part‐Time (High risk) w/PERS Hourly Part‐Time (High risk) w/o PERS FY16 19.226% 16.920% 8.550% 20.090% 11.720% TA's State Work Study State Non‐Work Study Federal Work Study Federal Non‐Work Study Work/Non‐Work Study (taking less than 6 credits) 0.650% 0.650% 0.650% 0.650% 0.650% 8.550% Compiled by OPBA. These assumptions are for modeling purposes only. They are subject to change. Page 1 of 3 FY17 19.226% 17.020% 8.550% 20.190% 11.720% 0.650% 0.650% 0.650% 0.650% 0.650% 8.550% The University of Montana Planning Assumptions ‐ Initial Fiscal Year 2016/2017 Updated May 29, 2015 Higher Education Price Index (HEPI)* Fiscal Year HEPI Yearly % 2006 253.1 5.1 260.3 2.8 2007 273.2 5.0 2008 279.3 2.2 2009 281.8 0.9 2010 2.3 288.4 2011 293.2 1.7 2012 297.8 1.6 2013 2014 306.7 3.0 *All US Public Colleges and Universities, 2014 Revised Series https://www.commonfund.org/CommonfundInstitute/HEPI/Page Utility Assumptions % Rate increases over past FY FY16 2.1% Electricity 0.0% Fuel Oil 0.3% NG‐Non‐Term 0.3% NG‐Term 3.6% Lab Gas 2.0% Water 4.8% Sewer Garbage 3.6% Estimates are within +5% Based on projections provided August 2014. FY17 2.1% 0.0% 2.0% 2.0% 3.4% 2.5% 5.5% 5.2% Projected Enrollment FY16 FTE Summer Fall Spring Fiscal Year Part time Full time Part time Full time Headcount Total 0 0 0 11,237 FY17 FTE Summer Fall Spring Fiscal Year Headcount Total 0 0 0 11,237 Administrative Assessment Assumptions 8.0% of actual expenses in FY14 for the FY16 assessment and in FY15 for the FY17 assessment excluding the following: Capital Transfers Out Scholarships and Waivers Assessment Paid in FY2014 for FY2016 Assessment Paid in FY2015 for FY2017 See the OPBA website for the preliminary FY16 Administrative Assessment calculations: http://www.umt.edu/plan/Budget/default.aspx Notes: If total assessment amount is over $1,000 the expense will be charged to your index code once per quarter. If the assessment amount is less than $1,000 then the expense will be charged to your index all at once ‐ usually this charge is made in the first quarter. Additional areas for consideration in planning Tort/Liability Insurance Inflation ‐ 29.4% in FY16 & 6.9% in FY17 Property Insurance Inflation ‐ 27.8% in FY16 & 5.1% in FY17 Auto Insurance Inflation ‐ 19.3% in FY16 & 6.9% in FY17 Library Acquisitions Inflation ‐ 7% IT Fixed Costs ‐ 7% All Other Operating Expense ‐ 3% See HEPI Index above Other State Pass Through Expense ‐ 0% All Other Operating Expense: (as supplied by the Governor's Office of Budget and Program Planning, OBPP) http://budget.mt.gov/Portals/29/Memo%208%20‐%20Budget%20Instructions%2017B.pdf FY16 FY17 62601 Electricity 2.30% 3.68% 0.39% 0.72% 62604 Laboratory Gas 62607 Propane 0.39% 0.72% 62216 Gasoline ‐4.93% ‐5.80% ‐4.93% ‐5.80% 62216A Aviation Gasoline 62242 Diesel Fuel ‐4.93% ‐5.80% 62242A Jet Fuel Compiled by OPBA. These assumptions are for modeling purposes only. They are subject to change. Page 2 of 3 63125 Library Books The University of Montana Planning Assumptions ‐ Initial Fiscal Year 2016/2017 Updated May 29, 2015 3.32% 5.03% Food Accounts 62205 62205A 62251 62252 62253 62254 62264 62275 62278 62279 62288 62289 62291 62292 Food Supplies Frozen Foods Meat Dairy Produce Bakery Grocery Poultry Beverages Red Meat Canned Goods Food Staples Seafood Pork 3.98% 3.98% 3.98% 3.98% 3.98% 3.98% 3.98% 3.98% 3.98% 3.98% 3.98% 3.98% 3.98% 3.98% 5.46% 5.46% 5.46% 5.46% 5.46% 5.46% 5.46% 5.46% 5.46% 5.46% 5.46% 5.46% 5.46% 5.46% Compiled by OPBA. These assumptions are for modeling purposes only. They are subject to change. Page 3 of 3
