Completion of Research Doctorates by UWSP Alumni: 2000-2009
advertisement
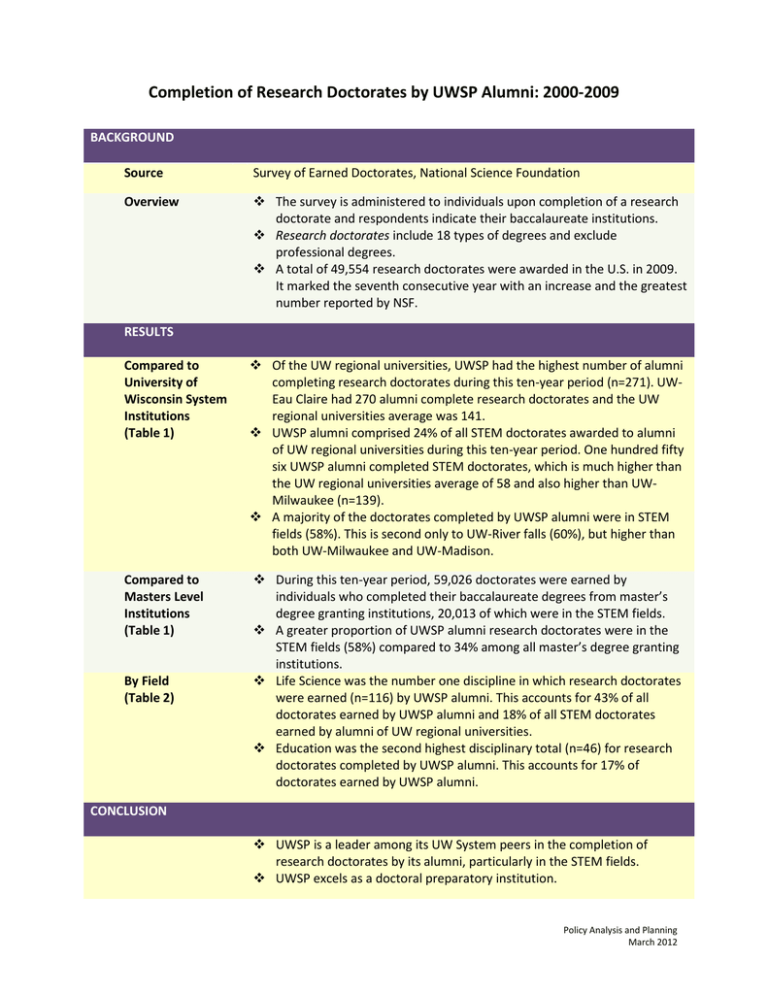
Completion of Research Doctorates by UWSP Alumni: 2000-2009 BACKGROUND Source Survey of Earned Doctorates, National Science Foundation Overview The survey is administered to individuals upon completion of a research doctorate and respondents indicate their baccalaureate institutions. Research doctorates include 18 types of degrees and exclude professional degrees. A total of 49,554 research doctorates were awarded in the U.S. in 2009. It marked the seventh consecutive year with an increase and the greatest number reported by NSF. RESULTS Compared to University of Wisconsin System Institutions (Table 1) Of the UW regional universities, UWSP had the highest number of alumni completing research doctorates during this ten-year period (n=271). UWEau Claire had 270 alumni complete research doctorates and the UW regional universities average was 141. UWSP alumni comprised 24% of all STEM doctorates awarded to alumni of UW regional universities during this ten-year period. One hundred fifty six UWSP alumni completed STEM doctorates, which is much higher than the UW regional universities average of 58 and also higher than UWMilwaukee (n=139). A majority of the doctorates completed by UWSP alumni were in STEM fields (58%). This is second only to UW-River falls (60%), but higher than both UW-Milwaukee and UW-Madison. Compared to Masters Level Institutions (Table 1) During this ten-year period, 59,026 doctorates were earned by individuals who completed their baccalaureate degrees from master’s degree granting institutions, 20,013 of which were in the STEM fields. A greater proportion of UWSP alumni research doctorates were in the STEM fields (58%) compared to 34% among all master’s degree granting institutions. Life Science was the number one discipline in which research doctorates were earned (n=116) by UWSP alumni. This accounts for 43% of all doctorates earned by UWSP alumni and 18% of all STEM doctorates earned by alumni of UW regional universities. Education was the second highest disciplinary total (n=46) for research doctorates completed by UWSP alumni. This accounts for 17% of doctorates earned by UWSP alumni. By Field (Table 2) CONCLUSION UWSP is a leader among its UW System peers in the completion of research doctorates by its alumni, particularly in the STEM fields. UWSP excels as a doctoral preparatory institution. Policy Analysis and Planning March 2012 Table 1: Research Doctorates Completed by Students Earning their BA/BS at a University of Wisconsin System Institution, 2000-2009 Number of 1 Doctorates Percentage of UW Regional Total Number of STEM 2 Doctorates Percentage of UW Regional STEM Total STEM Percentage of Institutional Total Stevens Point 271 17% 156 24% 58% Eau Claire 270 17% 94 15% 35% La Crosse 196 13% 90 14% 46% Whitewater 171 11% 37 6% 22% Oshkosh 149 10% 45 7% 30% River Falls 122 8% 73 11% 60% Green Bay 101 6% 37 6% 37% Platteville 85 5% 49 8% 58% Parkside 74 5% 28 4% 38% Stout 67 4% 12 2% 18% Superior 48 3% 19 3% 40% TOTAL 1,554 100% 640 100% UW-Madison UW-Milwaukee 2501 468 1285 139 51% 30% 58,722 20,013 34% UW Institution All Master's Degree Granting Institutions Source: NSF Survey of Earned Doctorates 1 Includes research doctorates only, such as Ph.D., Ed.D., D.M.A. Excludes professional degrees such as M.D., D.D.S., O.D., D.V.M., and J.D. 2 Includes Engineering, Geosciences, Life Sciences, Math and Computer Sciences, and Physical Sciences. Policy Analysis and Planning March 2012 Table 2: Research Doctorates Completed by Discipline of Students Earning their BA/BS from UW System Institutions1, 2000-2009 STP UW % of Regionals STP EAU GBY LAC OSH PKS PLT RVF STO SUP WTW Subtotal MAD MIL All UW TOTAL 7 3% 7 1 5 2 3 17 4 6 0 4 56 262 24 342 1 <1% 2 0 2 5 0 1 6 0 3 0 20 50 11 81 116 43% 59 29 48 27 13 17 43 5 8 21 386 747 69 1202 5 2% 3 4 5 3 4 3 2 1 1 3 34 82 14 130 27 10% 23 3 30 8 8 11 18 0 7 9 144 144 21 309 Architecture and Environmental Design 0 0% 2 0 0 0 0 0 0 0 0 0 2 1 0 3 Arts and Music 5 2% 9 0 5 2 3 3 2 0 4 3 36 60 15 111 Business and Management 1 <1% 6 4 5 3 1 1 2 4 0 10 37 38 8 83 Communication and Librarianship 10 4% 3 0 1 2 0 1 0 1 0 3 21 41 7 69 Education 46 17% 64 11 44 52 16 18 24 39 12 76 402 290 132 824 Humanities 13 5% 27 13 13 11 9 2 3 1 3 7 102 261 50 413 Law 0 0% 0 0 1 0 0 0 0 0 0 0 1 1 0 2 Other Non-sciences or Unknown Disciplines 0 0% 0 0 0 0 0 0 0 0 0 0 0 5 0 5 31 11% 34 24 11 16 9 3 8 6 4 25 171 218 62 451 Religion and Theology 2 1% 3 3 1 2 0 1 1 1 1 0 15 19 4 38 Social Sciences 7 3% 28 9 24 14 8 7 9 2 4 10 122 260 47 429 Social Service Professions 0 0% 0 0 1 2 0 0 0 1 0 0 4 21 4 29 Vocational Studies and Home Economics 0 0% 100% 0 1 0 0 0 0 0 0 1 0 2 1 0 3 Engineering Geosciences Life Sciences 2 Math and Computer Sciences Physical Sciences ³ Psychology Source: NSF Survey of Earned Doctorates Note: Highlighted cells denote disciplines used in STEM field calculations 1 Includes research doctorates only, such as Ph. D., Ed.D., D.M.A. Excludes professional degrees such as M.D., D.D.S., O.D., D.V.M., and J.D. ² Includes agricultural sciences, natural resources, biological sciences and health sciences. 3 Includes astronomy, chemistry, and physics. Policy Analysis and Planning March 2012
