Document 11885566
advertisement
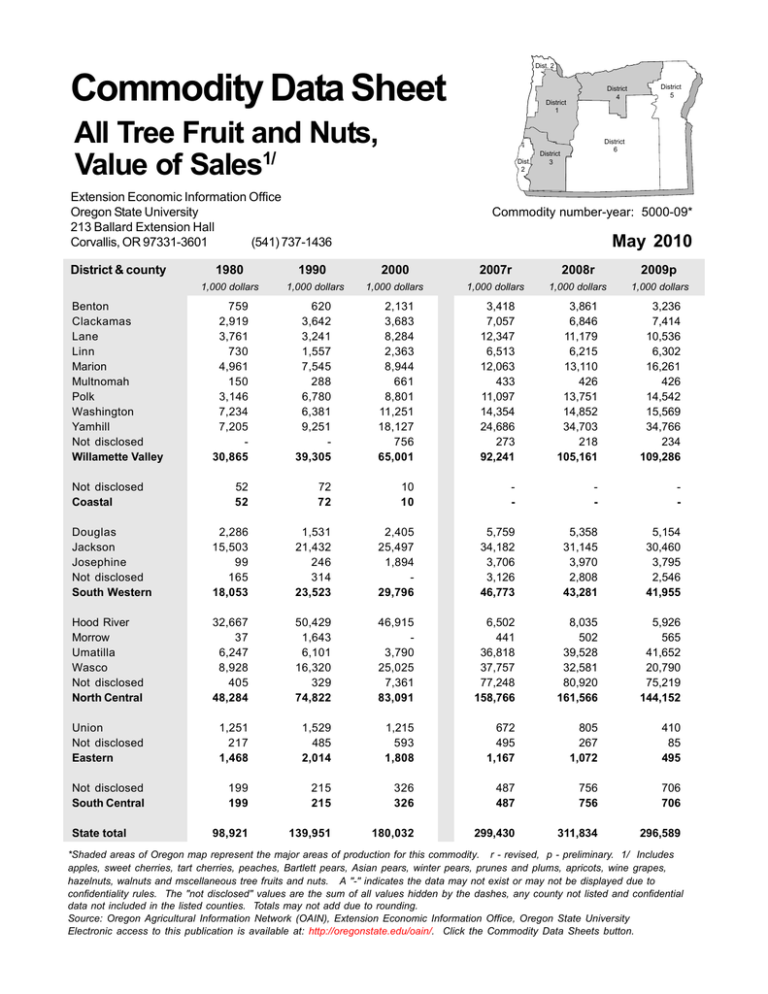
Dist. 2 Commodity Data Sheet All Tree Fruit and Nuts, Value of Sales1/ Dist. 2 Extension Economic Information Office Oregon State University 213 Ballard Extension Hall Corvallis, OR 97331-3601 (541) 737-1436 District & county District 4 District 1 District 5 District 6 District 3 Commodity number-year: 5000-09* May 2010 1980 1990 2000 2007r 2008r 2009p 1,000 dollars 1,000 dollars 1,000 dollars 1,000 dollars 1,000 dollars 1,000 dollars 759 2,919 3,761 730 4,961 150 3,146 7,234 7,205 30,865 620 3,642 3,241 1,557 7,545 288 6,780 6,381 9,251 39,305 2,131 3,683 8,284 2,363 8,944 661 8,801 11,251 18,127 756 65,001 3,418 7,057 12,347 6,513 12,063 433 11,097 14,354 24,686 273 92,241 3,861 6,846 11,179 6,215 13,110 426 13,751 14,852 34,703 218 105,161 3,236 7,414 10,536 6,302 16,261 426 14,542 15,569 34,766 234 109,286 52 52 72 72 10 10 - - - Douglas Jackson Josephine Not disclosed South Western 2,286 15,503 99 165 18,053 1,531 21,432 246 314 23,523 2,405 25,497 1,894 29,796 5,759 34,182 3,706 3,126 46,773 5,358 31,145 3,970 2,808 43,281 5,154 30,460 3,795 2,546 41,955 Hood River Morrow Umatilla Wasco Not disclosed North Central 32,667 37 6,247 8,928 405 48,284 50,429 1,643 6,101 16,320 329 74,822 46,915 3,790 25,025 7,361 83,091 6,502 441 36,818 37,757 77,248 158,766 8,035 502 39,528 32,581 80,920 161,566 5,926 565 41,652 20,790 75,219 144,152 Union Not disclosed Eastern 1,251 217 1,468 1,529 485 2,014 1,215 593 1,808 672 495 1,167 805 267 1,072 410 85 495 Not disclosed South Central 199 199 215 215 326 326 487 487 756 756 706 706 98,921 139,951 180,032 299,430 311,834 296,589 Benton Clackamas Lane Linn Marion Multnomah Polk Washington Yamhill Not disclosed Willamette Valley Not disclosed Coastal State total *Shaded areas of Oregon map represent the major areas of production for this commodity. r - revised, p - preliminary. 1/ Includes apples, sweet cherries, tart cherries, peaches, Bartlett pears, Asian pears, winter pears, prunes and plums, apricots, wine grapes, hazelnuts, walnuts and mscellaneous tree fruits and nuts. A "-" indicates the data may not exist or may not be displayed due to confidentiality rules. The "not disclosed" values are the sum of all values hidden by the dashes, any county not listed and confidential data not included in the listed counties. Totals may not add due to rounding. Source: Oregon Agricultural Information Network (OAIN), Extension Economic Information Office, Oregon State University Electronic access to this publication is available at: http://oregonstate.edu/oain/. Click the Commodity Data Sheets button. Selected tree fruits and nuts: Total production, Oregon, 1940-2009 Year Apples Million pounds All cherries Peaches All pears Prunes & plums Wine grapes Hazelnuts Tons Million pounds Tons Tons Tons Tons 1940 1950 1960 1970 1980 155.7 144.8 78.9 115.0 195.0 22,650 19,800 15,350 42,000 34,290 26.2 12.0 17.0 8.5 13.0 106,225 142,825 104,100 90,000 199,635 42,700 22,300 3,400 20,300 35,000 2,400 1,100 650 n/a 3,940 2,700 5,350 8,400 8,750 15,100 1985 1986 1987 1988 1989 160.0 105.0 205.5 155.0 160.0 30,250 41,000 57,150 62,100 57,500 14.5 13.0 14.0 12.7 12.5 192,430 161,670 227,743 212,850 215,020 22,400 19,000 15,000 18,000 11,000 5,944 6,600 7,935 7,750 7,450 24,300 14,900 21,500 16,300 12,800 1990 1991 1992 1993 1994 180.0 120.0 174.5 160.0 181.6 43,750 42,750 56,750 35,400 43,420 14.5 13.0 14.0 11.0 10.5 233,130 220,350 214,680 223,000 258,630 17,000 3,700 20,000 4,000 14,000 7,000 9,600 12,380 12,350 10,800 21,500 25,300 27,500 40,700 21,000 1995 1996 1997 1998 1999 140.0 154.3 159.6 152.5 144.2 31,750 33,250 48,572 55,601 51,590 9.0 7.0 5.8 8.0 7.0 230,000 175,000 260,315 250,643 212,162 5,000 6,000 12,000 10,500 13,000 14,000 15,000 18,500 14,700 17,900 38,700 18,750 46,650 15,400 39,700 2000 2001 2002 2003 2004 175.8 156.9 152.8 141.1 165.2 48,520 44,074 38,690 43,342 51,980 8.0 7.6 8.2 8.3 9.1 223,186 266,969 247,409 256,380 267,061 10,000 9,837 9,722 5,559 8,162 21,457 22,333 23,645 25,832 22,752 23,810 32,199 12,522 23,285 23,001 2005 2006 2007r 2008r 2009p 134.0 121.2 119.9 126.8 120.6 29,640 67,415 30,459 26,659 58,884 7.1 8.4 8.2 8.3 8.2 225,509 234,250 235,706 230,862 235,105 3,927 4,800 2,941 3,971 4,368 25,842 32,366 35,952 37,323 39,245 17,813 25,547 21,213 20,437 23,300 r - revised, p - preliminary. n/a - Not available. Sources: Oregon Agricultural Information Network (OAIN), Extension Economic Information Office, Oregon State University and USDA/NASS (National Agricultural Statistics Service) Oregon State University Extension Service offers educational programs, activities, and materials-without regard to race, color, religion, sex, sexual orientation, national origin, age, marital status, disability, and disabled veteran or Vietnam-era veteran status --as required by Title VI of the Civil Rights Act of 1964, Title IX of the Education Amendments of 1972, and Section 504 of the Rehabilitation Act of 1973. Oregon State University Extension Service is an Equal Opportunity Employer.
