STT 200 9-16-09 NAME__________________ ... Hand this in Tuesday 9-22-09.
advertisement
STT 200 9-16-09
NAME__________________
Hand this in Tuesday 9-22-09.
SECTION______________
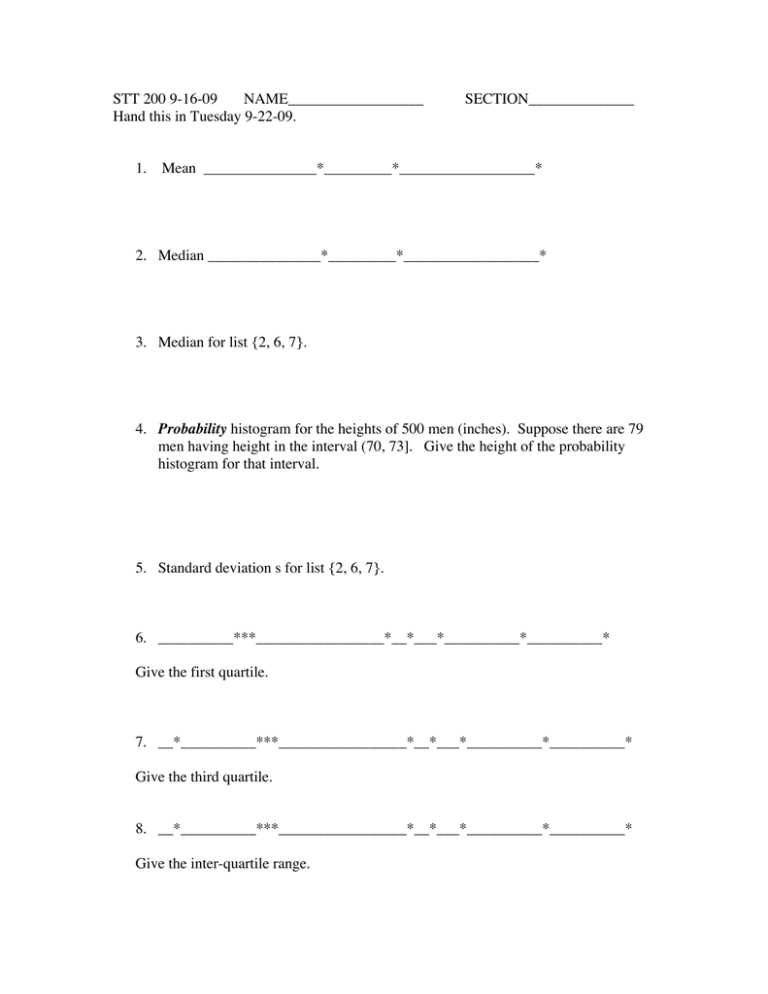
1. Mean _______________*_________*__________________*
2. Median _______________*_________*__________________*
3. Median for list {2, 6, 7}.
4. Probability histogram for the heights of 500 men (inches). Suppose there are 79
men having height in the interval (70, 73]. Give the height of the probability
histogram for that interval.
5. Standard deviation s for list {2, 6, 7}.
6. __________***_________________*__*___*__________*__________*
Give the first quartile.
7. __*__________***_________________*__*___*__________*__________*
Give the third quartile.
8. __*__________***_________________*__*___*__________*__________*
Give the inter-quartile range.
9. A list x has mean 4.6. Give the mean of the list 2x (all scores doubled).
10. A list y has mean 3.8. Give the mean of the list 2y + 3.
11. A list z has s = 2.2. Give s for the list 2z.
12. A list w has s = 5.7. Give s for the list w+19.
13. What principle from chapter 3 is routinely violated by graphs such as
this?
14. What is the underlying reason behind Simpson’s Paradox in the Berkeley
graduate admissions data mentioned in your book? Go on-line if you cannot get it
from the book.
15. Consult chapter 6 to answer this question. Suppose that honeybee hives produce
and average of 3.2 gallons with a standard deviation of 0.9 gallons. Assuming
that these production figures follow a normal (bell) distribution, sketch the
distribution. Be sure to label the maan 3.2 and s = 0.9 as recognizable elements of
your sketch. I plan to go over this topic Monday.
16. From your sketch (15), determine the percentage of hives producing between the
limits 3.2 +/- 0.9 gallons.


