PHOTOGRAMMETRIC TECHNIQUE FOR TEETH OCCLUSION ANALYSIS IN DENTISTRY
advertisement
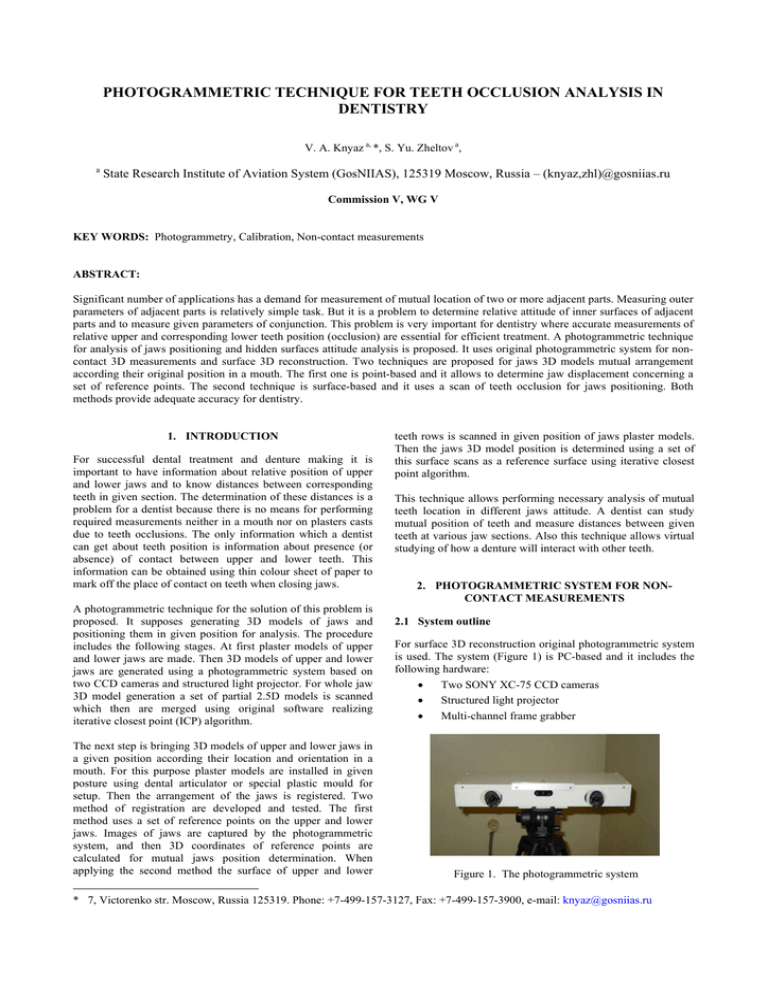
PHOTOGRAMMETRIC TECHNIQUE FOR TEETH OCCLUSION ANALYSIS IN DENTISTRY V. A. Knyaz a, *, S. Yu. Zheltov a, a State Research Institute of Aviation System (GosNIIAS), 125319 Moscow, Russia – (knyaz,zhl)@gosniias.ru Commission V, WG V KEY WORDS: Photogrammetry, Calibration, Non-contact measurements ABSTRACT: Significant number of applications has a demand for measurement of mutual location of two or more adjacent parts. Measuring outer parameters of adjacent parts is relatively simple task. But it is a problem to determine relative attitude of inner surfaces of adjacent parts and to measure given parameters of conjunction. This problem is very important for dentistry where accurate measurements of relative upper and corresponding lower teeth position (occlusion) are essential for efficient treatment. A photogrammetric technique for analysis of jaws positioning and hidden surfaces attitude analysis is proposed. It uses original photogrammetric system for noncontact 3D measurements and surface 3D reconstruction. Two techniques are proposed for jaws 3D models mutual arrangement according their original position in a mouth. The first one is point-based and it allows to determine jaw displacement concerning a set of reference points. The second technique is surface-based and it uses a scan of teeth occlusion for jaws positioning. Both methods provide adequate accuracy for dentistry. 1. INTRODUCTION For successful dental treatment and denture making it is important to have information about relative position of upper and lower jaws and to know distances between corresponding teeth in given section. The determination of these distances is a problem for a dentist because there is no means for performing required measurements neither in a mouth nor on plasters casts due to teeth occlusions. The only information which a dentist can get about teeth position is information about presence (or absence) of contact between upper and lower teeth. This information can be obtained using thin colour sheet of paper to mark off the place of contact on teeth when closing jaws. A photogrammetric technique for the solution of this problem is proposed. It supposes generating 3D models of jaws and positioning them in given position for analysis. The procedure includes the following stages. At first plaster models of upper and lower jaws are made. Then 3D models of upper and lower jaws are generated using a photogrammetric system based on two CCD cameras and structured light projector. For whole jaw 3D model generation a set of partial 2.5D models is scanned which then are merged using original software realizing iterative closest point (ICP) algorithm. The next step is bringing 3D models of upper and lower jaws in a given position according their location and orientation in a mouth. For this purpose plaster models are installed in given posture using dental articulator or special plastic mould for setup. Then the arrangement of the jaws is registered. Two method of registration are developed and tested. The first method uses a set of reference points on the upper and lower jaws. Images of jaws are captured by the photogrammetric system, and then 3D coordinates of reference points are calculated for mutual jaws position determination. When applying the second method the surface of upper and lower teeth rows is scanned in given position of jaws plaster models. Then the jaws 3D model position is determined using a set of this surface scans as a reference surface using iterative closest point algorithm. This technique allows performing necessary analysis of mutual teeth location in different jaws attitude. A dentist can study mutual position of teeth and measure distances between given teeth at various jaw sections. Also this technique allows virtual studying of how a denture will interact with other teeth. 2. PHOTOGRAMMETRIC SYSTEM FOR NONCONTACT MEASUREMENTS 2.1 System outline For surface 3D reconstruction original photogrammetric system is used. The system (Figure 1) is PC-based and it includes the following hardware: • Two SONY XC-75 CCD cameras • Structured light projector • Multi-channel frame grabber Figure 1. The photogrammetric system * 7, Victorenko str. Moscow, Russia 125319. Phone: +7-499-157-3127, Fax: +7-499-157-3900, e-mail: knyaz@gosniias.ru The system is designed for dentistry application and it have to provide measurement accuracy of about 0.04 mm. To meet this requirement with given cameras the working space of the system is chosen as 160x160x160 mm. positions. Then camera orientation parameters are estimated basing on image reference points coordinates as observations of points with known spatial coordinates. The results of system calibration are given in Table 1. Cameras are used for non-contact 3D measurement of surface coordinates using a photogrammetric approach. For automated identification of given surface point in images from left and right cameras (correspondence problem solution) stripe structured light is used. 2.2 System calibration The metric characteristics of 3D models produced by the system are provided by system calibration. Calibration procedure gives the estimation of interior orientation parameters basing on a set of images of special test field with known spatial coordinates of reference points. The problem of parameters determination is solved as estimation of unknown parameters basing on observation. Additional term describing non-linear distortion in co-linearity equations for perspective projection are taken in form: Δx = ay + xr K1 + xr K2 + xr K3 + (r + 2x )P1 + 2xyP2 2 4 6 2 σx, mm σy, mm σ,mm 0.0071 0.0052 0.0086 0.0061 0.0067 0.0092 Table 1. Results of system calibration σx, σy, σ are residuals of co-linearity conditions for the reference points after least mean square estimation concerning as precision criterion for calibration. 3. POINT-BASED OCCLUSION REGISTRATION 3.1 Plaster model setup 2 Δy = ax + yr 2 K1 + yr 4 K2 + yr6 K3 + 2xyP1 + (r 2 + 2 y 2 )P2 x = m x ( x − x p ); y = −m y ( y − y p ); r = x 2 + y 2 where Left camera Right camera xp, yp,-the coordinates of principal point, mx, my - scales in x and y directions, a – affinity factor, K1,K2,K3 – the coefficients of radial symmetric distortion P1,P2 - the coefficients of decentring distortion First method for occlusion registration is aimed on registering the relative displacement of upper and lower jaws. It uses a set of reference points on an upper and a lower jaw which determines the local coordinate system of each jaw. The stereo pair of the jaws plaster model with reference points is shown in the Figure 3. Four reference points (#1 - #4) on the lower jaw and four reference points (#5 - #8) are used for occlusion analysis. Reference points are marked with coded targets for accurate automated point identification and sub-pixel measurement. Image interior orientation and image exterior orientation (Xi, Yi, Zi – location and αi,ωi,κi and angle position in given coordinate system) are determined as a result of calibration. Figure 2. Calibration test field on the positioning stage Calibration process is fully automated due to applying two axis positioning stage and coded targets for reference point marking (Knyaz, 2002). Calibration program captures a set of test field images at different position controlled by positioning stage (Figure 2). Original calibration software controls test field orientating for image acquisition and test field image capturing at given Figure 3. The stereo pair of the jaws plaster model with reference points jaw models with registration plastic mould are used for upper jaw displacement estimation. 3.2 Point-based estimation Spatial coordinates of reference points calculated by the photogrammetric system are determined in object coordinate system referred to the test field. X and Y axes are situated in the plane of the test field, Y axis being directed up and X axis being directed to the right. Z axis is directed toward an observer. The object coordinate system is defined during external orientation of the photogrametric system. At first step jaw plaster models are installed in initial (reference) position accordingly natural central occlusion and reference points spatial coordinates are measured automatically by the photogrammetric system. For reproducing the position of real jaws in new (non-central) occlusion special plastic mass is used. The mould of teeth shape made on this plastic mass is used for installing jaw plaster copies accordingly the position of real jaws. It is placed between plaster jaw models and values of reference points spatial coordinates in new position are measured automatically by the photogrammetric system. Because of necessity to place plastic mould between jaw models the initial position of the lower jaw model also changes. So to find relative displacement of the upper jaw it is firstly required to determine the new position of the lower jaw. The transition matrix is determined by least mean square estimation of linear translation and rotation parameters which provides best fitting of lower jaw reference points at initial (reference) and new position of the lower jaw: Xn = A(α,ω,κ)⋅X + b Table 3 presents the upper jaw displacement relatively its reference position due to registration plastic cast installing. Displacement of reference points X Y Z 5 -0.702834 -1.66721 0.213742 6 -0.342446 -1.25036 0.185768 7 -0.402836 -1.07549 0.311374 8 -0.745331 0.216462 0.773238 Table 3. The parameters of upper jaw displacement At each step of the procedure the error of corresponding reference points superposition are calculated. They are concerned as a criterion of registration quality. The low level of the errors indicates that mutual position of the reference points cluster is not changed and results of occlusion registration are valuable. Table 4 presents the parameters of upper jaw displacement to given occlusion according plastic mould record and errors at reference points (precision of experiment). X Y Z Translation, mm 0.0235632 1.09383 0.0994412 Rotation, ° 0.270525 0.296401 -0.669212 Error for reference points where X – initial reference points coordinates, Xn – new reference points coordinates, A(α,ω,κ)– rotation matrix, B – translation vector. In Table 2 the parameters of lower jaw displacement and error at reference points after registration plastic cast installing for one of experiments is presented. X Y Z Translation, mm 9.08579 0.609782 2.763461 Rotation, ° 0.453748 0.0724305 1.70743 Error for reference points 1 0.00936135 0.013985 -0.0072014 2 0.0118679 -0.00149339 0..0292316 3 0.00416825 -0.0239597 -0.0159276 4 -0.0253975 0.0114681 -0.0061026 Table 2. The parameters of lower jaw displacement Then new upper jaw reference points coordinates for reference position are calculated using the transition matrix found at the previous step. This new coordinates and upper jaw reference points coordinates measured by the photogrammetric system for 5 0.0331227 -0.00402294 0.00468284 6 0.025844 0.0150891 -0.0193283 7 -0.0324345 -0.0176837 0.0218483 8 -0.0265322 0.00661761 -0.0072028 Table 4. The parameters of upper jaw displacement The developed technique allows to install jaw 3D models in the position according their real position in given occlusion and to estimate the parameters of translation and rotation of an upper jaw relatively a lower jaw. Also this technique for occlusion registration can be applied for adjacent teeth surfaces analysis by using spatial reference points coordinates along with jaws 3D models. 4. SURFACE-BASED OCCLUSION REGISTRATION 4.1 Plaster models scanning Photogrammetric system allows measuring 3D coordinates of any point on object surface observed by both cameras simultaneously. For object of complicated shape such as jaw plaster model it is impossible to view all necessary points of the object. So a set of partial object scans has to be obtained for whole surface of the object 3D model generation. Every partial object scan is made in its local reference system of coordinates specified by test field. Two partial scans of a jaw plaster cast are presented in Figure 4. Figure 4. Two partial scans of a jaw For whole 3D model generation from a set of scan several techniques can be applied such as reference point network designing, applying precise positioning stage with known position of axis, fragment merging using iterative closest point algorithm (Besl, 1992). The latter technique is applied for fragment merging with point-to surface metrics. This technique requires that merging scans have significant overlapping for proper work of iterative closest point algorithm. To generate whole 3D model of an upper jaw presented in Figure 5 a set of 28 scan is used. Various scans are shown in different colours to control visually a quality of merging. The mean error of scan merging is at the level of 0.02 mm. Figure 6. Jaw 3D model in single mesh form 4.2 Occlusion registration After generating 3D models both upper and lower jaws it is necessary to install these 3D models according jaws real position in a mouth. At first registration of jaws position is performed using dental articulator or silicon moulds made in mouth. Then plaster jaw model are installed in registered position using obtained silicon moulds. In this position the front surface of upper and lower teeth rows is scanned. The scan of the teeth front surface is then used as a reference surface for jaw 3D models translating into attitude corresponding real jaws occlusion. Resulting reference surface is presented in Figure 7. Figure 5 . Upper jaw 3D model from 28 scans The resulting 3D model consisting of a significant number of overlapping surfaces is not suitable for purposes of jaws occlusion analysis. So this 3D model is transformed in single mesh using interpolating mesh algorithm (Curless, 1996). The result of single mesh generation is shown in Figure 6. Figure 7. Jaws position registration Then 3D models of upper and lower jaws are bringing in registered position using iterative closest point algorithm. 5. OCCLUSION ANALYSIS Jaws 3D models installed in the position according their real occlusion allow investigating how hidden teeth surfaces are relatively located, this being important for teeth treatment and denture manufacturing. For occlusion analysis original software is developed. It supports the following functions: • 3D model visualization in different modes, • making given plane section of 3D model, • section contours visualization in forms of 2d or 3D curves, • Measuring given parameters in section plane. Figure 8 presents the user interface of the developed software. Figure 10. Jaws 2D section and occlusion measurement Figure 10 presents section of jaws 3D model and measuring distance between upper and lower teeth in section plane. 6. CONCLUSION The photogrammetric technique for occlusion analysis is proposed. It allows installing upper and lower jaw 3D models according their original position in a mouth by applying pointbased or surface-based technique. Figure 8. Software user interface User can make section manually defining the plane position or he can choose anthropometric points on teeth and analyze occlusion in plane corresponding to these points. Figure 9 shows the 3D section contours (the surface of the upper jaw is hidden). 3D modelling of occlusion provides a dentist by valuable mean for teeth hidden surfaces analysis. The accuracy of 3D models reconstruction and arrangement for both methods is sufficient for dentistry applications. The developed technique also can be successfully applied for analysis of joint parts of aggregates and mechanisms for industrial use. 7. REFERENCES Knyaz, V., 2002. Method for on-line calibration for automobile obstacle detection system. In: The international Archives of Photogrammetry and Remote Sensing, Proceedings of ISPRS Commission V Symposium “CLOSE-RANGE IMAGING, LONG-RANGE VISION”, Vol. XXXIV, part 5, Commission V, 2002, Corfu, Greece. Pp. 48-53. Besl, P.J., McKay, N.D., 1992. A method for registration of 3D shapes, In: IEEE Transactions on Pattern Analysis and Machine Intelligence, vol. 14, no.2, pp. 239-256. Curless, B., Levoy, M., 1996. A Volumetric Method for Building Complex Models from Range Images. In: SIGGRAPH 96 Conference proceedings, pp. 303-312. Figure 9: The 3D section contours
