ELIMINATION OF THE OUTLIERS FROM ASTER GDEM DATA
advertisement
ELIMINATION OF THE OUTLIERS FROM ASTER GDEM DATA
Hossein Arefi and Peter Reinartz
Remote Sensing Technology Institute
German Aerospace Center (DLR)
82234 Wessling, Germany
hossein.arefi@dlr.de, peter.reinartz@dlr.de
KEY WORDS: ASTER GDEM, SRTM, Digital Elevation Models, outliers, reconstruction segmentation, artifacts, anomalies
ABSTRACT:
Digital Elevation Models (DEM) provided by stereo matching techniques often contain unwanted outliers due to the mismatched
points. Detected outliers are candidate for wrong data that may otherwise adversely lead to model misspecification, biased parameter
estimation and incorrect results (Maimon and Rokach, 2005). Therefore detection of outlying observations and elimination of them
from the data is considered as one of the first steps towards obtaining a refined DEM. Several statistical and non-statistical methods are
available for analyzing the point cloud and extracting the outliers. The statistical methods often assume that the data follow a Gaussian
normal distribution and hence, they look for the observations which are represented doubtful based on mean and standard deviation.
In Digital Elevation Models generated from ASTER data the outliers, i.e., artifacts and anomalies, are represented as the following
types: residual clouds, and errors due to different stack numbers: it occurs when generating the final GDEM from variable number of
individual ASTER DEMs. In this paper a segment-based algorithm is proposed for detecting and eliminating the outliers from ASTER
GDEM images. Furthermore, a water mask is produced as an additional layer representing the lower quality of the pixels located on
inland water bodies. In the segment-based algorithm, the potential regions are iteratively extracted and evaluated using geometrical
feature descriptors to classify the outliers and non-outlier regions. After eliminating the location of the outliers in original ASTER
GDEM, an interpolation procedure is employed to fill the gaps. The quality of the final product is compared to the SRTM data and
quality parameters are measured.
1
INTRODUCTION
Recently, in July 2009, the Ministry of Economy, Trade, and Industry (METI) of Japan and the United States National Aeronautics and Space Administration (NASA) released the Global
Digital Elevation Models (GDEM) which is produced from Advanced Spaceborne Thermal Emission and Reflection Radiometer (ASTER) stereo images. The aim of the ASTER GDEM is
to provide a high accurate DEM which covers all the land on the
earth and it is freely available to all users. Furthermore it is aimed
to be used as a platform for analysis of the data in the fields of
disaster monitoring (e.g., volcanic or flood hazard map), hydrology (e.g., water resource management), energy (e.g., oil resource
exploration), and Stereoscopic visualization (e.g., for Bird’s-eye
views and flight simulations) (ERSDAC, 2010).
The ASTER GDEM is generated with spatial resolution of about
30m (1 arc-second) from original 15m ASTER image resolution
in the horizontal plane. Therefore, considering the resolution, the
ASTER GDEM contains the highest resolution of freely available DEMs for the users in internet. The Shuttle Radar Topography Mission (SRTM) DEM and the Global Topographic Data
(GTOPO30) are the other available global DEM released before
ASTER GDEM with 90m and 1000m posting interval, respectively.
The Aster GDEM covers land surfaces between 83o and −83o .
Additionally the ASTER GDEM data is available for high latitude and steep mountainous areas where are not covered by SRTM
due to radar shadowing and foreshortening effects (ERSDAC,
2010).
The vertical and horizontal accuracies of ASTER GDEM are estimated in pre-production level at 95% confidence as 20m and
30m, respectively. Prior to releasing the ASTER GDEM data to
the global user community in July 2009, an extensive preliminary
validation study in cooperation with the U.S. Geological Survey
(USGS), ERDAS, and other collaborators have been performed
(NASA/METI, 2009). The results of the accuracy assessment by
this study proves that the pre-production estimated vertical accuracy of 20m at 90% is globally correct. Some tiles contain
a vertical accuracy better than 20m and in some other tiles it is
worse.
According to this report the data contain artifacts and anomalies
which can produce large elevation errors on local scales. Those
errors occur mainly in the areas with small ”stack numbers” or
in the region with persistent ”clouds”. The artifacts due to existing small stack numbers appear as straight lines, “pits”, “bumps”,
“mole-runs”, and other geometric shapes. The specifications of
the mentioned errors are summarized in ASTER GDEM report as
follows (NASA/METI, 2009):
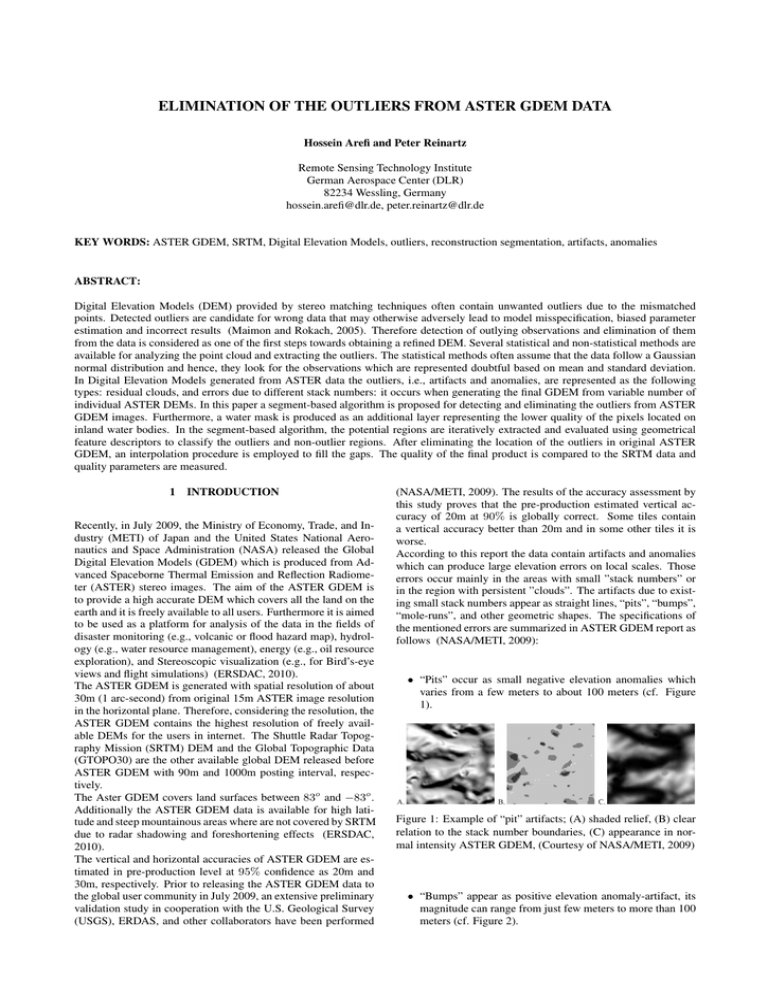
• “Pits” occur as small negative elevation anomalies which
varies from a few meters to about 100 meters (cf. Figure
1).
Figure 1: Example of “pit” artifacts; (A) shaded relief, (B) clear
relation to the stack number boundaries, (C) appearance in normal intensity ASTER GDEM, (Courtesy of NASA/METI, 2009)
• “Bumps” appear as positive elevation anomaly-artifact, its
magnitude can range from just few meters to more than 100
meters (cf. Figure 2).
2005) is employed to extract the regional extrema regions. The
geodesic dilation differs with basic dilation where an image and
a structuring element involve in the filtering process. In geodesic
dilation additionally the dilated image is “masked“ with a predefined ”mask“ image. Equation 1 shows the geodesic dilation of
image J (marker) using mask I.
Figure 2: Example of “bump” artifacts; (A) shaded relief, (B)
clear relation to the stack number boundaries, (C) appearance
in normal intensity ASTER GDEM, (Courtesy of NASA/METI,
2009)
• “Mole runs” are positive curvilinear anomalies, less common than pits and bumps, and occur in relatively flat terrains. The corresponding magnitude of “Mole runs” much
less than the two previous anomalies and ranging from barely
perceptible to few meters, and rarely more than 10 meters
(cf. Figure 3).
Figure 3: Example of “mole-run” artifacts; (A) shaded relief, (B)
clear relation to the stack number boundaries, (C) less appearance
in normal intensity ASTER GDEM, (Courtesy of NASA/METI,
2009)
(1)
δI (J) = (J
M
B)
^
I,
(1)
V
In this equation, stands for the point-wiseLminimum between
the dilated image and the mask image, J
B is the dilation
of J with the elementary isotropic structuring element B. Image reconstruction is obtained if the geodesic dilation of image
J repeats until stability, as stated in Equation 2 and visualized in
Figure 4.
δ
(n)
|I
(1)
(1)
(1)
(J) = δI (J) ◦ δI (J) ◦ .... ◦ δI (J)
{z
ntimes
(2)
}
Figure 4: Grayscale reconstruction of mask f from marker g
(Courtesy of Vincent (1993))
As stated, the artifacts and anomalies produced due to the small
and different stack numbers are almost apparent in all the ASTER
GDEM tiles. In addition, the effects of residual clouds have been
already reduced in Version 1 of the ASTER GDEM by replacing
the elevation with -9999 values (NASA/METI, 2009). Another
shortcoming of the existing ASTER GDEM version is that the
inland water mask has been applied in data refinement procedure
and therefore, the pixel values regarding the inland lakes are not
accurate.
the profile shown in Figure 4 represents the result of reconstruction using geodesic dilation. To suppress the regional maxima of
image f (mask) a marker image g is generated with a lower gray
values than the f . The reconstructed image (gray color on right
image) is the result of geodesic dilation until stability reached.
As illustrated, the regional maxima regions are suppressed in reconstructed image (cf. Figure 4, right, gray-colored segment).
More information regarding the segmentation of the DEMs by
gray scale reconstruction using geodesic dilation can be found in
(Arefi, 2009) where similar algorithms are employed for extracting the 3D objects as well as the ridge lines from high resolution
LIDAR DSM.
According to the above mentioned problems, a segmentation based
algorithm is proposed for detection and elimination of the outliers, i.e., artifacts and anomalies, from the ASTER GDEM images. Additionally a “water mask” corresponding to the inland
water is automatically extracted which indicates the lower quality of the GDEM pixels in water body areas.
In segmentation algorithm based on geodesic reconstruction, selecting an appropriate ”marker“ image plays the main role and
has a direct effect on the quality of the final reconstructed image.
A ”marker” image with a small offset, e.g., few meters, from the
“mask” can suppress mainly local maxima regions similar to the
artifacts above the ground.
The paper is organized as follows: in Section 2 the proposed algorithm for segmentation based detection and removal of the outliers from ASTER GDEM is explained and corresponding theoretical background of the algorithm is described. Section 3 represents the experimental results of the proposed algorithm. Finally,
the results are evaluated and the conclusions are given in Section
4.
2
2.1
SEGMENTATION BASED OUTLIER DETECTION
ALGORITHM
Theoretical Background
In this paper, an algorithm based on image reconstruction using
geodesic morphological dilation (Vincent, 1993, Arefi and Hahn,
2.2
Proposed Algorithm
Proposed outlier extraction algorithm regarding the positive artifacts and anomalies is represented in Figure 5. The first step for
segmentation based outlier detection is to generate the “marker”
image as second input image. The first input image is the original
ASTER GDEM as “mask” image. The marker is generated by
subtraction of an offset value h from the ASTER GDEM:
mask+ = GDEM
marker = mask+ − h
where mask+ is the ”mask” image employed to extract the ”positive” outliers.
Since the artifacts are in most cases located far beyond the ground
Figure 7: Local Range Variation (LRV) feature descriptor
Figure 5: Proposed workflow for extracting positive outliers
elevation level with low height variation of their internal pixels, a
single offset value (h) of about “25 meters“ generates an appropriate marker image for segmentation of the outliers. This is a
basic assumption for the outlier elimination algorithm, i.e., if an
outlier area connects with a smooth transition to the ground in its
neighborhood, it cannot be not detected by the algorithm.
Figure 6 shows a small ASTER GDEM tile with (420 × 550 pixels) which is termed as ”mask“ in this algorithm. After providing the second input image (”marker”) the image reconstruction
ImRec is measured accordingly. For segmentation purpose the
reconstructed image is subtracted from the original DEM. The result is a normalized DEM similar to normalized Digital Surface
Model (nDSM) where the regions standing about h meter higher
than their neighborhood are highlighted. Similar results can be
achieved by morphological ”tophat” but the operation based on
geodesic dilation is independent from the size of the objects to
be filtered, therefore, no need to tune the size of the structuring element,i.e., B. Segmentation procedure is implemented us-
25m) the region will be classified as outlier and its location will
be eliminated from the original data set.
Similar process is utilized to eliminate the negative outliers but
in this case the complementary image of the ASTER GDEM is
selected as “mask” and therefore:
mask− = max(GDEM ) − GDEM
marker = mask− − h
where mask− is used to extract the negative outliers and is measured by subtracting the whole pixels of GDEM from the maximum value. Classified outlier regions in this step are then integrated and corresponding locations are eliminated from the original ASTER GDEM. Figure 8 illustrates the final detected outliers
Figure 8: Final detected outliers
Figure 6: ASTER GDEM sample data; color coded
ing thresholding and the labeled regions are provided by means
of connected components analysis. A geometric feature descriptor is created which highlights the height variation on each pixel
regarding its adjacency to evaluate the labeled regions. Local
Range Variation (LRV) feature is created by subtracting the maximum and minimum values in every 3 × 3 windows over the
image (cf. Figure 10). All the boundary pixels of the detected
regions are evaluated by LRV descriptor. The regions having certain height jumps on their boundary pixels will be evaluated as
outliers (positive artifacts). In practice, the LRV values of the
boundary of each region are extracted and if the majority (here
90 percent) of LRV values are above the threshold (here above
from the example ASTER GDEM image.
A second criteria is considered for final refinement of the classification step into outlier and inliers regions. As stated in the
introduction section, in production of the ASTER GDEM the
pixels inside inland water bodies are not filtered and therefore
they contain lower quality. In this step a water mask binary image is provided as a sort of quality layer which warns the user
about the lower quality of the height points inside water body
areas. Also, the water mask layer can directly be used to filter
out all the height points inside the water. In order to provide
high quality water mask the vector map containing the boundary points of the shoreline regions in different resolutions are
automatically extracted from the “Global Self-consistent, Hierarchical, High-resolution Shoreline Database” (GSHHS) which
is a high-resolution shoreline data set and it is freely available to
download (GSHHS, 2009).
In the final step, the gaps provided by the outliers are filled by
applying spatial interpolation procedure. In this paper the Inverse
Distance Weighting (IDW) interpolation method is utilized.
3
RESULTS AND DISCUSSION
ASTER GDEM data are originally partitioned into 1o × 1o tiles
and are therefore, comprised of 22600 tiles cover land surfaces
between 83o N and 83o S. The sample tile of N 58E027 is tested
in this section contains 3601 × 3601 pixels with pixel size of
0.0002777777845o or 1 arc-second ( 30m). Figure 9 shows the
sample tile including a large water body area. After employing
are classified as outliers. A threshold value of 20m is selected for
this test data. Figure 11 represents the final binary image regarding to the outliers after integrating positive and negative outliers.
Figure 11: Detected outliers
Figure 9: ASTER GDEM, N58E027
the image reconstruction based algorithm for segmentation procedure, provided regions are evaluated using geometric feature LRV
(cf. Figure 10). The boundary pixels of each regions are evalu-
For further refinement, a water mask layer is generated (cf. Figure 12) and compared to the original ASTER GDEM. To provide
final refined ASTER GDEM, corresponding pixels of outliers and
water bodies are eliminated from the original ASTER GDEM and
produced gaps are filled using Inverse Distance Weighting (IDW)
interpolation technique (cf. Figure 13).
Figure 12: Water mask
Figure 10: Local Range Variation (LRV) generated from original
ASTER GDEM
ated and the regions located higher (or lower for negative outliers) than their neighborhood with more than a predefined value
To qualitative assessment of the final ASTER GDEM, corresponding SRTM DEM (cf. Figure 14) has been compared to both
ASTER GDEM data before and after outlier removal procedure.
The SRTM data is first resampled from 3 arc-second (90m) pixel
mean
RMSE
Quantile (90%)
SRTM-ASTER(orig.)
8.74m
11.84m
19m
SRTM-ASTER(refined)
8.21m
11.72m
18m
Table 1: Statistical evaluation of ASTER GDEM before and after
elimination of outliers in comparison to SRTM data
4
CONCLUSIONS AND FUTURE WORK
In this paper a segmentation based algorithm is proposed for extracting the artifacts and anomalies (outliers) from the ASTER
GDEM. Only the artifacts or anomalies that are clearly higher
or lower (for negative outliers) than the neighborhood can be
extracted with this algorithm. The artifacts with small height
discontinuity or with smooth transition in some boundary pixels
cannot be detected particularly in mountainous regions therefore,
selecting a small threshold for LRV feature descriptor might extract part of the mountains. The result shows an overall improvement on the quality of the GDEM. For future work, an image
containing the stack numbers can be used as additional classification layer which might help to extract the other artifacts and
anomalies that are still remained in the final result.
Figure 13: Final ASTER GDEM after IDW interpolation of gaps
and removing water pixels
resolution to 1 arc-second (30m) to be comparable with ASTER
products. Visual comparison between SRTM and ASTER GDEM
REFERENCES
Arefi, H., 2009. From LIDAR Point Clouds to 3D Building Models. PhD thesis, Bundeswehr University Munich.
Arefi, H. and Hahn, M., 2005. A morphological reconstruction
algorithm for separating off-terrain points from terrain points in
laser scanning data. In: International Archives of Photogrammetry, Remote Sensing and Spatial Information Sciences, Vol. 36
(3/W19).
ERSDAC, 2010. Earth Remote Sensing Data Analysis Center.
www.ersdac.or.jp.
GSHHS, 2009. Global Self-consistent, Hierarchical, Highresolution Shoreline database. www.ngdc.noaa.gov.
Maimon, O. and Rokach, L., 2005. Data mining and knowledge
discovery handbook. In: Springer, September 2005, p. 131.
NASA/METI, 2009. Aster Global DEM validation summary report. www.gdem.aster.ersdac.or.jp. Last access April 2010.
Vincent, L., 1993. Morphological grayscale reconstruction in image analysis: Applications and efficient algorithms. IEEE Transactions on Image Processing 2, pp. 176–201.
Figure 14: SRTM, converted to 30m pixel resolution, N58E027
shows the existing height data inside most of the water regions in
ASTER GDEM as well as a clear height offset between these two
data set. Since both images are color coded in the same stretching
manner, the SRTM looks about 10m higher than ASTER GDEM.
To make an accurate measurement the difference image between
SRTM and ASTER GDEM data are generated and statistical parameters are measured (cf. Table 1)
The statistical measurement also proves the existence of offset
between SRTM and ASTER GDEM. On the other hand, it shows
a clear improvement of the statistical parameters after eliminating
the outliers.
