WEB-BASED MODEL FOR ANALYSIS OF TIME SERIES REMOTELY SENSED DATA
advertisement

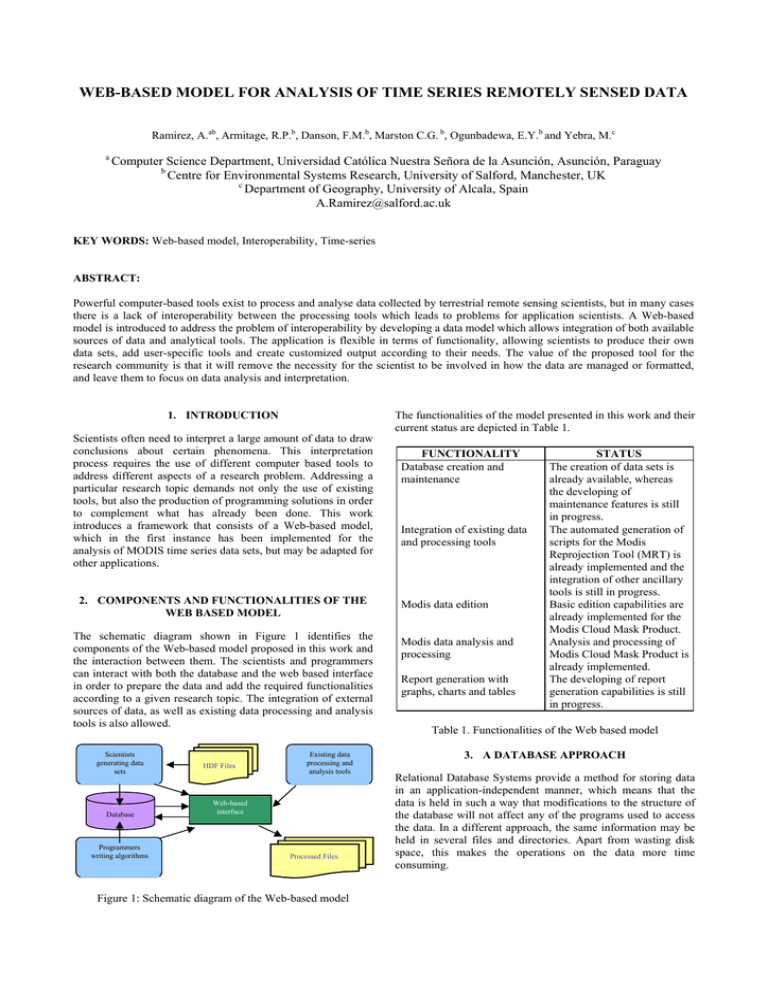
WEB-BASED MODEL FOR ANALYSIS OF TIME SERIES REMOTELY SENSED DATA Ramirez, A.ab, Armitage, R.P.b, Danson, F.M.b, Marston C.G. b, Ogunbadewa, E.Y.b and Yebra, M.c a Computer Science Department, Universidad Católica Nuestra Señora de la Asunción, Asunción, Paraguay b Centre for Environmental Systems Research, University of Salford, Manchester, UK c Department of Geography, University of Alcala, Spain A.Ramirez@salford.ac.uk KEY WORDS: Web-based model, Interoperability, Time-series ABSTRACT: Powerful computer-based tools exist to process and analyse data collected by terrestrial remote sensing scientists, but in many cases there is a lack of interoperability between the processing tools which leads to problems for application scientists. A Web-based model is introduced to address the problem of interoperability by developing a data model which allows integration of both available sources of data and analytical tools. The application is flexible in terms of functionality, allowing scientists to produce their own data sets, add user-specific tools and create customized output according to their needs. The value of the proposed tool for the research community is that it will remove the necessity for the scientist to be involved in how the data are managed or formatted, and leave them to focus on data analysis and interpretation. The functionalities of the model presented in this work and their current status are depicted in Table 1. 1. INTRODUCTION Scientists often need to interpret a large amount of data to draw conclusions about certain phenomena. This interpretation process requires the use of different computer based tools to address different aspects of a research problem. Addressing a particular research topic demands not only the use of existing tools, but also the production of programming solutions in order to complement what has already been done. This work introduces a framework that consists of a Web-based model, which in the first instance has been implemented for the analysis of MODIS time series data sets, but may be adapted for other applications. 2. COMPONENTS AND FUNCTIONALITIES OF THE WEB BASED MODEL The schematic diagram shown in Figure 1 identifies the components of the Web-based model proposed in this work and the interaction between them. The scientists and programmers can interact with both the database and the web based interface in order to prepare the data and add the required functionalities according to a given research topic. The integration of external sources of data, as well as existing data processing and analysis tools is also allowed. Scientists generating data sets Database Programmers writing algorithms HDF Files Existing data processing and analysis tools Web-based interface Processed Files Figure 1: Schematic diagram of the Web-based model FUNCTIONALITY Database creation and maintenance Integration of existing data and processing tools Modis data edition Modis data analysis and processing Report generation with graphs, charts and tables STATUS The creation of data sets is already available, whereas the developing of maintenance features is still in progress. The automated generation of scripts for the Modis Reprojection Tool (MRT) is already implemented and the integration of other ancillary tools is still in progress. Basic edition capabilities are already implemented for the Modis Cloud Mask Product. Analysis and processing of Modis Cloud Mask Product is already implemented. The developing of report generation capabilities is still in progress. Table 1. Functionalities of the Web based model 3. A DATABASE APPROACH Relational Database Systems provide a method for storing data in an application-independent manner, which means that the data is held in such a way that modifications to the structure of the database will not affect any of the programs used to access the data. In a different approach, the same information may be held in several files and directories. Apart from wasting disk space, this makes the operations on the data more time consuming. The idea behind using a Database System for storing MODIS data relies on the fact that within a database the data is stored in way that makes it easily accessible. Another key concept of this approach is flexibility, as developments can progress around a database in an incremental way. The Relational Database System chosen for this work was Oracle 10g Express Edition (Oracle Database XE) which is free to develop, deploy and distribute. The database was tested in both Windows XP and Unix-based operating systems. Additional tests were made using MySQL and PostgreSQL which are both open source database systems. 3.1 Building Datasets The model presented in this work allows scientists to produce their own datasets which can be processed at any time from its creation. Metadata are used to describe the information associated with these datasets. In fact, metadata describes how and where a particular set of data was acquired, and how the data is formatted. This gives relevant information not only to the scientists, but also to the programmers, who are developing the different functionalities within the model, in order to interact with the data. For example, an image is just a matrix of numbers without associated metadata to describe what is being represented. 4.2 The Modis Cloud Mask Scientific Data Set The Modis Cloud Mask Scientific Data Set (SDS) is part of the science parameters of the Modis Cloud Mask Product and contains the cloudiness information. Each pixel in the Cloud Mask is assigned 6 bytes (48 bit array). Individual bits or group of bits are set to denote various cloud conditions and characteristics for that pixel. Table 3 gives a description of the information stored in the first byte of the Cloud Mask SDS. Bits 0 Field Description Cloud Mask Flag 1-2 Unobstructed FOV Quality Flag 3 Day / Night Flag 4 Sunglint Flag 5 Snow / Ice Background Flag Land / Water Background Flag 6-7 Bit Interpretation Key 0 = Not Determined 1 = Determined 0 = Confident Cloudy 1 = Probably Cloudy 2 = Probably Clear 3 = Confident Clear 0 = Night 1 = Day 0 = Yes 1 = No 0 = Yes 1 = No 0 = Water 1 = Coastal 2 = Desert 3 = Land 4. WORKING EXAMPLE: CLOUD COVER DATA Table 3. First Byte of the Cloud Mask Scientific Data As a working example, we focused on the Modis Cloud Mask Product which indicates whether a given view of the earth surface is obstructed by clouds or optically thick aerosol. All Modis Standard Products are in the Hierarchical Data Format (HDF) which is a physical file format for storing and sharing scientific data (Weaver and Singh, 2002). The Cloud Mask Product is generated at 1 kilometre and 250 metres spatial resolutions. There are two Modis Cloud Mask data product files: MOD35_L2, containing data collected from the terra platform, and MYD35_L2, containing data collected from the Aqua platform (Modis, 2007). The information encoded in the Unobstructed FOV Quality Flag has four possible combinations, as can be seen in Table 4. This information indicates the probability of clear sky for every pixel in the image. 4.1 Modis Data Processing Tools HDF View HDF Tool Description Tool for reprojecting Modis images into standard map projections. Tool for browsing and editing HDF files. Multifunctional data processing and visualization tool for Modis data. Value of Bit 3 0 0 1 1 Bit Interpretation Key Cloud 66% Probability of Clear 95% Probability of Clear 99% Probability of Clear Table 4. Possible values of the Unobstructed FOV Quality Flag Tools for working with Modis data are freely available from the Internet. A number of these tools were integrated into the framework being developed (Table 2). Tool Modis Reprojection Tool (MRT) Value of Bit 2 0 1 0 1 Limitations Not suitable for processing a large amount of images at once. Very basic editing capabilities. Not suitable for processing a large amount of images at once. Table 2. Modis data processing tools used in this research 4.3 Bit Extraction Process An algorithm was written to perform the bit extraction. It takes Modis Cloud Mask Product file as an input, while the output overwrites the value of the first byte of the Cloud Mask SDS for every pixel in the image, taking into account only the values of the second and third bit which have the relevant information. The image in Figure 2 covers the United Kingdom and surrounding areas and shows the information stored in the first byte of the Cloud Mask SDS (Table 3) which corresponds to a Modis Cloud Mask Product HDF file. The resulting image after performing the bit extraction is shown in Figure 3. January 2005 is 0-41% and the range for September 2005 is 065%. Figure 2. Image before performing the bit extraction Confident Clear Probably Clear Probably Cloudy Confident Cloudy Probability of clear sky Low Figure 3. Image after performing the bit extraction High Figure 5. January 2005 5. DATA ANALYSIS After processing a set of images corresponding to a given year, two stacks of binary files were produced with the intention of calculating the cloud cover probability in a given region. The pixel values of the images within the first stack indicate whether the Cloud Mask Algorithm was executed or not. Whereas the pixels values of the images within the second stack indicate cloudy areas or a high probability of clear sky. The analysis process is shown in Figure 4. 0 – Not determined 1 – Determined 0 – Not Cloud Free 1 – Cloud Free STACK #2 STACK #1 Under certain conditions, the Cloud Mask Algorithm is not executed and the pixels are set to 0. STACK #1 After calculating the ratio between the two stacks, a single file is produced showing the certainty of clear sky for every pixel. STACK #2 This stack indicates whether a pixel presents 100 percent probability of clear or not. Figure 4. Data analysis process 6. RESULTS The values of the pixels in the images (Figure 5, Figure 6) show the percentage of cloudy days across England, Scotland and Wales corresponding to January and June 2005. The darker areas suggest higher probability of clouds, while the brighter areas indicate higher probabilities of clear sky. The range for Probability of clear sky Low High Figure 6. June 2005 7. CONCLUSIONS After processing remotely sensed data within the framework proposed, the following advantages are noted: • • • • Easy creation and maintenance of large data sets. Faster processing of data sets. Flexibility for integrating existing ancillary tools. Easily adaptable programming solutions to existing processes. The model proposed in this work has some limitations that are being addressed in order to improve the overall performance. The redundancy in the information stored in the database will be reduced after optimizing the data analysis process. The integration of existing data processing and analysis tools has also to be improved. Further work will expand the model in order to perform the processing of other Modis product files. We will continue to test the bit-extraction algorithm on other years, and we will also work on speeding up the processing time of the images which will allow faster processing of data for longer periods of time. REFERENCES Modis Atmosphere. http://modis-atmos.gsfc.nasa.gov/MOD35_ L2/index.html (accessed 3rd April 2007). Weaver, R., Singh, S., 2002. Extracting and Viewing Bit-Level Metadata in EOS Files. Earth Science Technology Conference – Pasadena, CA (USA). ACKNOWLEDGEMENT This research was funded by the EU Alfa programme ICONE under grant AML/19.0902/97/0666/II-0380-FA-FI.


