PHOTOGRAMMETRIC DOCUMENTATION AND MODELLING OF AN
advertisement
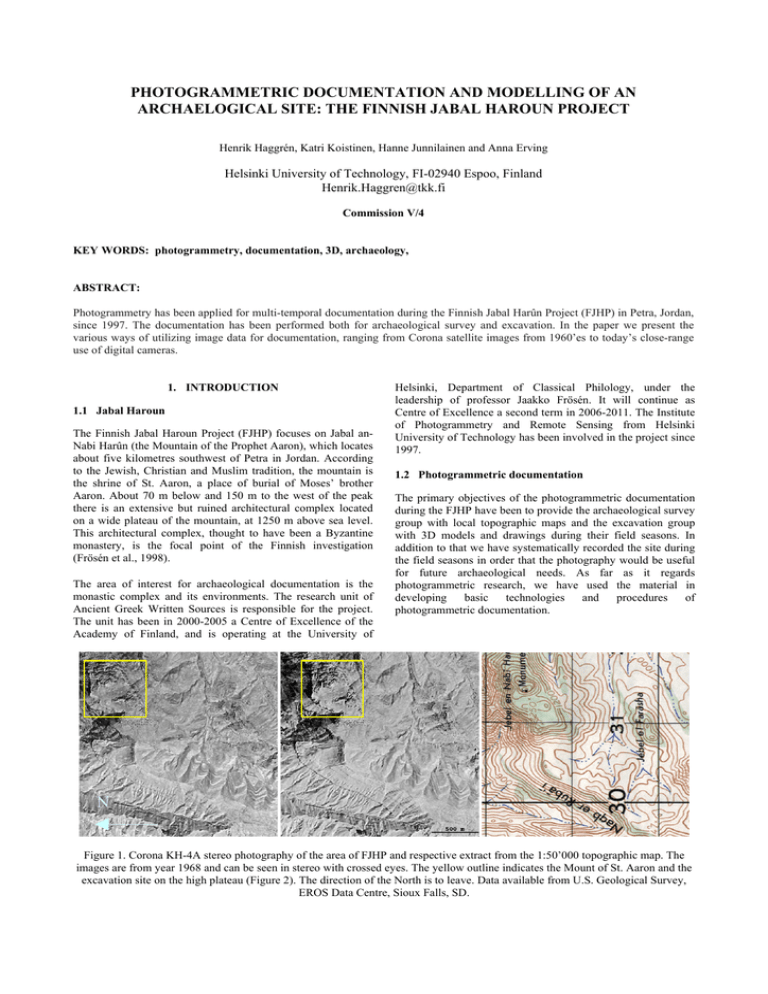
PHOTOGRAMMETRIC DOCUMENTATION AND MODELLING OF AN ARCHAELOGICAL SITE: THE FINNISH JABAL HAROUN PROJECT Henrik Haggrén, Katri Koistinen, Hanne Junnilainen and Anna Erving Helsinki University of Technology, FI-02940 Espoo, Finland Henrik.Haggren@tkk.fi Commission V/4 KEY WORDS: photogrammetry, documentation, 3D, archaeology, ABSTRACT: Photogrammetry has been applied for multi-temporal documentation during the Finnish Jabal Harûn Project (FJHP) in Petra, Jordan, since 1997. The documentation has been performed both for archaeological survey and excavation. In the paper we present the various ways of utilizing image data for documentation, ranging from Corona satellite images from 1960’es to today’s close-range use of digital cameras. 1. INTRODUCTION 1.1 Jabal Haroun The Finnish Jabal Haroun Project (FJHP) focuses on Jabal anNabi Harûn (the Mountain of the Prophet Aaron), which locates about five kilometres southwest of Petra in Jordan. According to the Jewish, Christian and Muslim tradition, the mountain is the shrine of St. Aaron, a place of burial of Moses’ brother Aaron. About 70 m below and 150 m to the west of the peak there is an extensive but ruined architectural complex located on a wide plateau of the mountain, at 1250 m above sea level. This architectural complex, thought to have been a Byzantine monastery, is the focal point of the Finnish investigation (Frösén et al., 1998). The area of interest for archaeological documentation is the monastic complex and its environments. The research unit of Ancient Greek Written Sources is responsible for the project. The unit has been in 2000-2005 a Centre of Excellence of the Academy of Finland, and is operating at the University of Helsinki, Department of Classical Philology, under the leadership of professor Jaakko Frösén. It will continue as Centre of Excellence a second term in 2006-2011. The Institute of Photogrammetry and Remote Sensing from Helsinki University of Technology has been involved in the project since 1997. 1.2 Photogrammetric documentation The primary objectives of the photogrammetric documentation during the FJHP have been to provide the archaeological survey group with local topographic maps and the excavation group with 3D models and drawings during their field seasons. In addition to that we have systematically recorded the site during the field seasons in order that the photography would be useful for future archaeological needs. As far as it regards photogrammetric research, we have used the material in developing basic technologies and procedures of photogrammetric documentation. N Figure 1. Corona KH-4A stereo photography of the area of FJHP and respective extract from the 1:50’000 topographic map. The images are from year 1968 and can be seen in stereo with crossed eyes. The yellow outline indicates the Mount of St. Aaron and the excavation site on the high plateau (Figure 2). The direction of the North is to leave. Data available from U.S. Geological Survey, EROS Data Centre, Sioux Falls, SD. 2. IMAGE ACQUISITION 2.1 Imagery In order to provide data for wider analysis of the topography and the history of the area, we have used satellite images and cartographic maps of the Petra and its surroundings in Wadi Araba. The oldest satellite images, which we have from the site, are Corona KH-4A images taken in 1968 (Figure 1). They are originally panoramic films, which are recorded forward and backwards with an inclination of 15 degrees. The base-to-height ratio of the stereo photography is 0,54 and the ground resolution of the original images is better than 10 meters (McDonald, 1997; Smith, 1997). We have received the film negatives U.S. Geological Survey, and rectified scanned images to the local cartographic reference system (UTM). The rectification is performed with a Thin Plate Spline transformation, which is available within the PCI Geomatics’ GCPWorks Image Registration software (PCI Geomatics, 2005). The ground control points were collected from a KVR1000 orthophoto (Figure 2). The KVR-1000 images are high-resolution spaceborne images, which have been digitised from film negatives. They are produced by Sovinformsputnik and delivered for end users as orthophotographs (Sovinformsputnik, 2005). The standard ground resolution of a scanned KVR-1000 image is 2 m. The images are rectified on a digital terrain model based on TK-350 images. N Figure 2. Mount of St. Aaron and the excavation site on the high plateau extracted from the KVR-1000 orthophoto. The image is from year 2000 before the FJHP field season. The yellow outline indicates the area of the excavation and the FJHP camp (Figure 3). The white building on the top of the mountain is the shrine of St. Aaron. The direction of the North is to left. Data available from Sovinformsputnik, Moscow, Russia. The aerial photographs, which are available, are from years 1981 in scale 1:15’000 and 1992 in scale 1:30’000. We have got them as paper prints, and we have scanned them. In addition, we have some low-altitude hand-held aerial photographs from the site, which have been taken by Bob Bewley from the English Heritage. They are from the field season of year 2000. In general, it is rather difficult to get the site photographed from air. However, the entire Petra area is optimal for terrestrial topographic photogrammetry. The terrain is free from vegetation and most times one has the possibility to take pictures of the terrain by climbing up the opposite slopes of the wadi or tributary. 2.2 Digital terrain models One of the first tasks in preparation of a full-scale archaeological field survey of the Jabal Haroun area was to produce a digital terrain model, or DTM (Figure 4), and largescale topographic maps. These were processed from the 1:15’000 scale photography. The stereoscopic restitution was done with an analytical plotter from the paper prints. The block triangulation was based on the 1:50’000 topographic map. Later on, the area of the DTM has been enlarged to cover the entire surrounding of the Mount of St. Aaron (Figure 5). N Figure 3. The excavation area and the FJHP camp on the plateau of Mount of St. Aaron during the field season of year 2000. The direction of the North is to left. Image taken by Bob Bewley. The reference coordinate system of the DTM is the Palestinian UTM grid. This was defined by shrine of St. Aaron, which was marked on the map, and for which we had the coordinates. The azimuth was defined visually using other visible landmarks. The level reference, Z-coordinate or height, was defined using summits or hilltops selected throughout the area. About 10-15 tie-points were selected from each image for the block triangulation. We utilize the internal geometry of the imager chips to create a common spherical reference frame (Haggrén, et al., 2004). Panoramic and spherical images are used for documenting archaeological structures or views, which are difficult to document with an image of ordinary optics. We have applied spherical imaging for recording of both exterior and interior surroundings (Figure 7). Figure 4. 3D visualization of the Mount of St. Aaron and the excavation area and the seen from west. The model and its texture are based on aerial photography from 1981. 1997 1998 1999 2001 Figure 5. The DEMs, which were processed from aerial images, have provided the basic cartographic reference material for the project. The area of interest has gradually enlarged and covers the entire surrounding of the Mount of St. Aaron. Figure 6. Panoramic imaging. Concentric images are projected to a common plane by 2-D projective transformations Figure 7. Panoramic view from Umm al Biara down to Petra valley. This sequence of three images corresponds to an approximate angle of view of 40°x130°. 2.3 Panoramic photography We have extensively studied the use of panoramic photography for photogrammetric documentation during the FJHP since the first field seasons in 1997 (Haggrén et al., 1999). A panoramic image consists of two or more images that are acquired without moving the projection centre (Figure 6). The images in the sequence should have an overlap of 30 to 50 %. With help of corresponding points or features all images are rectified into a common plane or cylinder. During the rectification, lens distortions are compensated. The resulting image is spherical; it is both concentric and linear, and can be used for photogrammetric applications. The further strong features are, that they are high-resolution and wide-angle composite images. Figure 8. An interior panoramic image of a wall of an apse. The images are rectified onto cylinder. This sequence of five concentric images corresponds to an approximate angle of view of 40° x 210°. 3. PHOTOGRAMMETRIC RECONSTRUCTION 3.1 Field surveying The archaeological survey aims at understanding settlement and environmental history of Jabal Haroun. According to the latest results, the area has been settled from the late phases of the Early Palaeolithic to the present. The main objective of the archaeological survey is to investigate the settlement history reflected through sites and finds dating to the different periods. Cartographers record significant topographical features of the surveyed area, download data daily into the project database, and create detailed 3D models of the area of current interest. This helps in imagining and understanding of the relationship between the environment and the remains of former humanmade agricultural multipurpose installations (Figure 9). It is also crucial, that during the short field season the archaeologists can concentrate on the archaeological survey, rather than surveying. The field surveying system consists of digital tacheometers and cameras. For terrestrial photography, we have used both video and frame cameras. Since 1997, we have used Sony Handycam CCD video cameras and Olympus Camedia C-1400L and Olympus Camedia C-4000. For the purpose of concentric photography, we have applied mechanical cross-slide mounts on camera stands or geodetic tripods. The reference coordinate system, which we use in field, is WGS84. The network was originally built and triangulated in 1998. This has been enlarged during later field seasons and now practically covers the entire surrounding of the Mount of St. Aaron. From geodetic point of view, surveying is necessary in order to tighten the DTM and to produce layouts and maps of archaeological sites and trenches. Archaeologists also need rather immediate, but detailed and exact 3D on-site reconstructions of the remains of constructions. From photogrammetric point of view, photographs have primarily been used in field as evidence only, documenting the current situations. An extraordinary motivation for developing photogrammetric documentation within FJHP has been to intensify the field works of archaeological survey. We have introduced a procedure for archaeologists, according to which they could apply image prints of A4 size as a kind of photogrammetric notebook. For example, when the barrage systems and terrace walls are identified in field, they are documented on prints as well. These graphical notes become then part of images and can be located in 3D models like any original image content (Figure 10). Figure 9. An architect’s imagination of an ancient view containing agricultural installations (Aaro Söderlund, 1999). Figure 10. Terrace wall systems are sketched on the prints by archaeologists. Control points, which are used for orienting images into a global coordinate system, are marked as triangles on the image. Tacheometers have been the only reasonable tool for detailed on-site mapping of 3D geometric data. However, the time that is necessary for performing the tacheometer recordings will remarkably reduce the time available for the archaeological survey as well as for excavations. Therefore it has been beneficiary to develop the approach of using images as photogrammetric notebooks. In case a DTM already exists, detailed mapping can be based on monoplotting (Figure 11). The coordinates of any new point P' identified on a single image will be determined in 3D as the intersection P between the DTM surface and the collinear image ray. As far as both the terrain surface in the DTM and the orientation of the image are approximate, the 3D coordinates of the new points will be approximate (P) as well. However, as long as the original image observations P' are also included and stored in the database, the correct location of P can be always refined by a subsequent bundle adjustment. Simultaneously, DTM and the orientation data become refined. Figure 12. Monoplotting. Collinear intersection of image observation P’ with existing DTM locates the point in 3D as P. The location (P) is used as a cartographic approximation in database unless a DTM is created. 3.2 Terrestrial topographic photogrammetry Terrestrial topographic photogrammetry has been performed in two ways. First, large-baseline stereoscopic pairs of panoramic image sequences have been used for tightening of the DTM. Second, close-up and short-baseline stereo images have been used for stereoscopic interpretation and visualization. In order to be used for DTM a stereoscopic pair of panoramic image sequences is recorded aside the road (Figures 13 and 14). These can be typically taken at a longer distance, as the landscape is open and free of vegetation. The base-to-distance ratio may vary from 1:5 to 1:20. In most cases there are no control measurements available and the orientations have to be based on existing feature data. Whenever possible, the camera station points will be measured with tacheometer. propose that corresponding features are used instead of corresponding points (Haggrén et al., 2004). This is due to the fact that inaccuracy in finding corresponding homologous points leads to scattered polygonal shapes. The aerial DTM was interpreted and processed as triangular network and the distance between two adjacent points for example on the road area varies between 20 to 50 meters. The terrestrial stereo models were be used for densification of this with a regular grid of 4 meters and with additional break lines. We interpreted occluded areas and outlined them from DTM before a new triangular network was processed (Figure 14). 3.3 Photogrammetric surveying of barrages and terrace walls We have developed photogrammetric documentation in order to be applied for 3-D measuring of structural remains of barrage systems and terrace walls as part of archaeological survey. Panoramic stereo photography has been used for wide area documentation, whereas for detailed structures we have applied close up stereo photography (Figures 16 and 17). The procedure has been experimented in field and the results indicate that the accuracy of applying panoramic imagery for archaeological survey is satisfactory. However, in case of farrange and large-baseline photogrammetric application we Figure 13. Survey area and the ancient road leading from Wadi Araba to Jabal Haroun and Petra. The 3D model is based on the aerial DTM and the data, which has been recorded in field with tacheometer. The red arrows indicate the part of the road, which is visible in Figure 14. Figure 14. Panoramic images are used for horizontally wide-angle terrestrial topographic photogrammetric works. The yellow outline indicates the area of the densified DTM in Figure 15. 3.4 Photogrammetric documentation of the excavation Figure 15. Part of the DTM that was tightened based on stereo photogrammetric surveying of panoramic images. Figure 16. Panoramic stereo images of terrace walls at Jabal Farasha taken during the field season of 2003. The stereoscopic view can be seen with crossed eyes. The progress of archaeological works on the excavation site (Figure 19) has been regularly recorded. During the field seasons since 1998 images have been taken daily. The aim has been to develop simple recording methods for multi-temporal archaeological documentation in such way, that the images can be later used for photogrammetric reconstruction. The digital images have also been utilized to record specific information related to the conservation work. Thus the photographs serve as a visual diary and can be used later for example in recovering data, which might have been lost during the excavations (Frösén et al., 2002). The photography has been performed before the sunrise, when there are no shadows and the. It is also necessary, that the excavation works be not underway during the photography. Daily images have been recorded with digital camera. Video cameras have been used more rarely. As the basic geometry of the trenches and the constructions is continuously measured with tacheometers, the features of the 3D models can be used for image orientation. Some times additional control points are marked on the printouts and measured with the tacheometer. The usual way for multi-temporal image orientation is to include old tie points to the new block adjustment. 3.5 Simplified 3D modelling From the very beginning, it was evident that the project’s archaeological database shall be combined with GIS information and 3-D modeling. The database of the project has been developed with the thought of combining multi-temporal textual information, site descriptions, digital imagery and spatial data into one interrelated system. For the relational database, the Microsoft Access 97 proved to be useful, while Bentley’s Microstation 95 became the project’s all-in-one 3-D modeling platform, as well as the GIS and mapping tool. For mapping, Terrasolid’s a Terrasurvey module has been applied. Figure 17. The barrages in the tributary are documented with close-up stereo photography. . Figure 19. The Monastic complex of St. Aaron during the excavations in 2003. The view is from the shrine of St. Aaron. The arrow indicates the location of the chapel that is shown in 20 and 21. (Koistinen, 2004.) Figure 18. Terraces are measured from the images after the field season. Measured structures are included to the DTM as well as to the archaeological database. amount of digital image data, and the data enable the selection of appropriate imagery for future processing. Figure 22. The model of the apse area. The simplified 3D model is used for visual exterior orientation of image frames (Koistinen, 2004). Figure 20. The chapel has been excavated during three field seasons: Trench C in 1998, Trench I in 2000, and Trench Y in 2003. 3D-data recorded with tacheometer. (Koistinen, 2004). 3.6 Photo-realistic 3D modelling Photo-realistic 3D models have been created to 1) document the archaeological excavation, 2) visualize the process of the excavation during an archaeological work, and 3) support archaeologist in their analyses. Currently, PhotoModeler 5 software is used for creating 3D models. In addition to the modeling purposes, all images since 1997 will be considered as an archaeological photo archive, and scientists can subsequently return to achieve material and attain new information. Additional models from different stages of the excavation are produced independently and later oriented together. As a result, the process of the excavation will be presented as a multitemporal 3D model. In addition, detailed attribute data of an object can be added in an accurate geographical location. Figure 21. Progress of the excavation in the chapel in trenches C and Y. Images are from two seasons, 1998 and 2003. They are from upper row left to down right: 1998-08-02 (from W towards E), on 1998-08-14 (from SW towards NE), on 199808-30 (from NW towards SE), and on 2003-08-25. (Koistinen, 2004). Every afternoon, the 3D tacheometer data of all structures, strata, loci, features, and main artifacts, which emerged or were noted during the excavation, are downloaded into the project database and added to the existing model. Linking the form records to the measured points in 3-D space is also done in order to show the spatial relationships between different categories of data. One of the photogrammetric ideas evolved during the project has been to extract simplified 3D models and use them in gathering preliminary data for image orientation (Koistinen, 2004). Viewing points and scene directions of the images relative to the 3D models will be determined by visual orientation (Rönnholm, 2003). The images have been organized by date and preliminary georeferencing will be available from the photo diary. The need of proper orientation data for image management has also grown in parallel to ever-increasing Figure 23. Convergent images are used for 3D wire frame modeling and the 3D model is georeferenced into the local coordinate system by tacheometer measurements (Junnilainen, 2005). 5. REFERENCES Frösén, J., Fiema, Z. T., Haggrén, H., Koistinen, K., Lavento, M., and, Peterman, G. 1998, 'The Finnish Jabal Haroun Project. Report on the 1997 Season', Annual of the Department of Antiquities of Jordan (ADAJ) 42 (1998), Amman, pp. 483-502. Frösén, J., Fiema, Z. T., Lavento, M., Koistinen K., 1999. The Finnish Jabal Haroun Project. Report on the 1997 Season. Annual of the Department of Antiquities of Jordan (ADAJ) 42 (1998), Amman, pp. 483-502. Frösén, J., and Fiema, Z., 2002. Petra - a city forgotten and rediscovered. Helsinki 2002, Publications of Amos Anderson Art Museum, New Series No 40, pp. 133-142. Haggrén, H., Pöntinen, P., and Mononen, J., 1998. Concentric image capture for photogrammetric triangulation and mapping and for panoramic visualization. Videometrics VI, Proc. SPIE 3641, p.17-21 (1998). Haggrén, H; Nuikka, M.; Junnilainen, H.; Järvinen, J.; 2001. Photogrammetric approach for archaeological documentation of an ancient road. In: XVIII International Symposium CIPA 2001, 18.-21.9.2001, Potsdam, Germany. Offset-Druckerei Gerhard Weiert GmbH, Berlin 2002, CIPA, pp.108-113. Haggrén, H., Hyyppä, H., Jokinen, O., Kukko, A., Nuikka, M., Pitkänen, T., Pöntinen, P. and Rönnholm, P., 2004a. Photogrammetric application of spherical imaging. ISPRS Panoramic Photogrammetry Workshop. Dresden, Germany. 1922 February 2004. Haggrén, H., Junnilainen, H., Järvinen J., Nuutinen, T., Lavento M., and Huotari M., 2004b. The use of panoramic images for 3D Archaeological Survey In: The International Archives of Photogrammetry, Remote Sensing and Spatial Information Sciences, Istanbul, Turkey, Vol. 34, Part XXX. Figure 24. A 3D wire frame model of the chapel area and corresponding photorealistic model with projected image textures (Junnilainen, 2005). Junnilainen, H., 2005. Photogrammetric Documentation for Archaeology in Finnish Jabal Harûn Project, Amman, 2005. 4. DISCUSSION Koistinen, K.; Latikka, J.; Mononen, J.; Pöntinen, P., and Haggrén H., 1999. On the Development of 3D Documentation for Archaeology during Finnish Jabal Haroun Project. In: The International Archives of Photogrammetry and Remote Sensing. Thessaloniki, Greece. Vol. XXXII, Part 5W11 p. 63-68. The long duration of an archaeological project sets special demands on the documentation. When this project started in 1997 we already knew that it would last at least five years. Technical development during the project has been evident. However, the imagery of this archaeological documentation is already unique. The progress of the excavation cannot be repeated and the surroundings are changing continuously. The progress of the excavation is visualized with collected multi-temporal imagery. The main idea behind the collection of the imagery has been to do it regularly and so that the images can be orientated into the same coordinate system. The need for control points is clearly reduced by taking the majority of the images as concentric panoramic image sequences. The selection of the appropriate imagery for further refinement of the model is supported with the photo diaries and the use of the simplified 3D model. During the next phase of the project data collection and transmission procedures will be further streamlined and simplified. Koistinen, K., 2000. 3D Documentation for Archaeology during Finnish Jabal Haroun Project. In: The International Archives of Photogrammetry and Remote Sensing, Amsterdam, Holland, Vol. XXXIII, Part B5/1, pp.440-445 Koistinen, K.; Latikka, J.; Pöntinen, P., 2001. The Cumulative 3D Data Collection and Management During An Archaeological Project. In: XVIII International Symposium CIPA 2001, 18.-21.9.2001, Potsdam, Germany. OffsetDruckerei Gerhard Weiert GmbH, Berlin 2002, CIPA, pp. 223228 Koistinen, K., 2002. GIS at the Crossroads of History, The Jabal Haroun (Mountain of Aaron) Project. GeoInformatics 5 (December), pp. 6-9 Koistinen, K., 2004. Multitemporal archaeological imagery to model the progress of excavation. The International Archives of Photogrammetry, Remote Sensing and Spatial Information Sciences, Istanbul, Turkey, vol. 34, part xxx. McDonald, Robert A., 1997). Corona, Argon, and Lanyard: A Revolution for US Overhead Reconnaissance. Corona: Between the Sun & the Earth, The First NRO Reconnaissance Eye in Space, (Editor: Robert A. McDonald), American Society for Photogrammetry and Remote Sensing, Bethesda, USA, p. 6174. PCI Geomatics, 2005. PCI Geomatics Developer's Corner Online Help Gateway, http://www.pcigeomatics.com/dev_corner/pcihlp_gateway.html [Last visited: June 23, 2005] Pictran, 2000. Pictran-D/E Release 4, Programmbeschreibung und Benutzeranleitung, Technet GmbH, Berlin 2000. Pollefeys, M.; Koch R.; Vergauwen, M.; and Van Gool, L., 1999. An automatic method for acquiring 3D models from photographs: applications to an archaeological site. In: The International Archives of Photogrammetry and Remote Sensing. Thessaloniki, Greece. Vol. XXXII, Part 5W11 p. 76-80. Pöntinen, P., 1999, On the Creation of Panoramic Images from Image Sequence, The Photogrammetric Journal of Finland, Vol. 16, No. 2, pp. 43-67. Rönnholm, P., Hyyppä, H., Pöntinen, P., Haggrén, H. and Hyyppä, J., 2003. A Method for Interactive Orientation of Digital Images Using Backprojection of 3D Data, The Photogrammetric Journal of Finland, Vol 18, No. 2, p. 58-59. Smith F. Dow, 1997. The Design and Engineering of Corona’s Optics. Corona: Between the Sun & the Earth, The First NRO Reconnaissance Eye in Space, (Editor: Robert A. McDonald), American Society for Photogrammetry and Remote Sensing, Bethesda, USA, p. 111-120. Sovinformsputnik, 2005. Digital Geo-Coded Imagery, http://www.sovinformsputnik.com/p_geocod.html [Last visited: June 23, 2005] 6. ACKNOWLEDGEMENTS The Academy of Finland, Jenny and Antti Wihuri Foundation, and Finnish Cultural Foundation are gratefully acknowledged for financial support.
