THE COMPARISON OF THE WAVELET- BASED IMAGE COMPRESSORS
advertisement
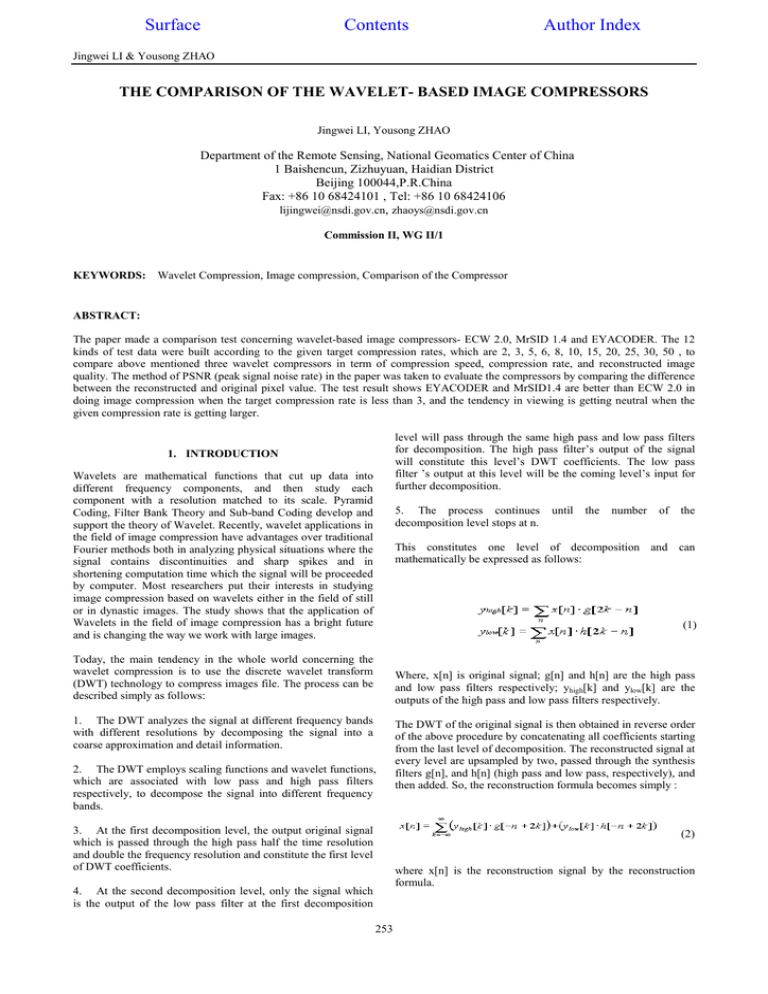
Surface Contents Author Index Jingwei LI & Yousong ZHAO THE COMPARISON OF THE WAVELET- BASED IMAGE COMPRESSORS Jingwei LI, Yousong ZHAO Department of the Remote Sensing, National Geomatics Center of China 1 Baishencun, Zizhuyuan, Haidian District Beijing 100044,P.R.China Fax: +86 10 68424101 , Tel: +86 10 68424106 lijingwei@nsdi.gov.cn, zhaoys@nsdi.gov.cn Commission II, WG II/1 KEYWORDS: Wavelet Compression, Image compression, Comparison of the Compressor ABSTRACT: The paper made a comparison test concerning wavelet-based image compressors- ECW 2.0, MrSID 1.4 and EYACODER. The 12 kinds of test data were built according to the given target compression rates, which are 2, 3, 5, 6, 8, 10, 15, 20, 25, 30, 50 , to compare above mentioned three wavelet compressors in term of compression speed, compression rate, and reconstructed image quality. The method of PSNR (peak signal noise rate) in the paper was taken to evaluate the compressors by comparing the difference between the reconstructed and original pixel value. The test result shows EYACODER and MrSID1.4 are better than ECW 2.0 in doing image compression when the target compression rate is less than 3, and the tendency in viewing is getting neutral when the given compression rate is getting larger. level will pass through the same high pass and low pass filters for decomposition. The high pass filter’s output of the signal will constitute this level’s DWT coefficients. The low pass filter ’s output at this level will be the coming level’s input for further decomposition. 1. INTRODUCTION Wavelets are mathematical functions that cut up data into different frequency components, and then study each component with a resolution matched to its scale. Pyramid Coding, Filter Bank Theory and Sub-band Coding develop and support the theory of Wavelet. Recently, wavelet applications in the field of image compression have advantages over traditional Fourier methods both in analyzing physical situations where the signal contains discontinuities and sharp spikes and in shortening computation time which the signal will be proceeded by computer. Most researchers put their interests in studying image compression based on wavelets either in the field of still or in dynastic images. The study shows that the application of Wavelets in the field of image compression has a bright future and is changing the way we work with large images. 5. The process continues decomposition level stops at n. until the number of the This constitutes one level of decomposition and can mathematically be expressed as follows: (1) Today, the main tendency in the whole world concerning the wavelet compression is to use the discrete wavelet transform (DWT) technology to compress images file. The process can be described simply as follows: Where, x[n] is original signal; g[n] and h[n] are the high pass and low pass filters respectively; yhigh[k] and ylow[k] are the outputs of the high pass and low pass filters respectively. 1. The DWT analyzes the signal at different frequency bands with different resolutions by decomposing the signal into a coarse approximation and detail information. 2. The DWT employs scaling functions and wavelet functions, which are associated with low pass and high pass filters respectively, to decompose the signal into different frequency bands. 3. At the first decomposition level, the output original signal which is passed through the high pass half the time resolution and double the frequency resolution and constitute the first level of DWT coefficients. The DWT of the original signal is then obtained in reverse order of the above procedure by concatenating all coefficients starting from the last level of decomposition. The reconstructed signal at every level are upsampled by two, passed through the synthesis filters g[n], and h[n] (high pass and low pass, respectively), and then added. So, the reconstruction formula becomes simply : (2) where x[n] is the reconstruction signal by the reconstruction formula. 4. At the second decomposition level, only the signal which is the output of the low pass filter at the first decomposition 253 IAPRS, VOLUME XXXIV, PART2, COMMISSION II, Xi’an, Aug. 20-23, 2002 Interpreting the DWT coefficients sometimes can be rather difficult because the way DWT coefficients being presented is rather peculiar. Different compressors have their own technology to analyze the image at different frequency bands, to find the filters, to quantize and encode the information in order to provide perfect reconstruction image. reconstructed image quality. The method we take in the test is: firstly, we use the above mentioned compressors to compress the same digital black and white aerial image according the given target compression rates; secondly, we decompress all of the compressed image using their own decompressors and plug-ins and store the decompressed images in tiff, respectively; thirdly, we compare the difference of the each pixel value between the original image and the reconstructed image; finally, we evaluate the compressors through the change of the pixel value. The purpose of this paper is to find the difference among selected compressors based on wavelets through the test and to provide some valuable information on how to select compressors for doing the image’s compression. we use the PSNR( Peak Signal Noise Rate) to compare the processed image quality between the original and the reconstructed image, and the formula can be described as follows: 2. TEST 2.1 Conditions The image used in the test is the 9312×9284 grayscale (256) Fujian Black and White aerial digital image, scanned by the Ultra5000 in the resolution of 25U and stored in tiff format. The file size is about 85M. (3) (4) All test were performed on a Hp computer corporation’s HP l600 computer with the following key components: Where, RMSE (root mean squared error) is the square root of the MSE (mean squared error); f(i,j) is pixel value located in the i(row) and j(column) in the original raster image; F(i,j ) is pixel value located in the i(row) and j(column) in the reconstructed raster image; N2 is the number which is equal to I multiples j. Intel 933MHZ Pentium III microprocessor 512M SDRAM ELSA Synergy II-32 video card /32 M RAM IBM-DTLA-307030 60GB HARD DISK WINDOWS 2000 Professional The work chart of the test can be described in Figure 1. The wavelet compressors used in the test are Earth Resource Mapper’s Enhanced Compressed Wavelet Compressor V2.0 (ECW), LizardTech’s MrSID Workstation Geospatial Encoder V1.4 (MrSID) and EYACODER(EYA). 2.3 Test Data The table 1 below listed the test data according to the above work chart. 2.2 Method In order to compare compressors, we put our interests in three key facets: compression speed, compression rate, and Rate Actual Rate Compressed Time eya ecw sid eya ecw sid 2 2.23 3.00 2.11 1.57 1.03 3 3.10 3.60 3.05 1.54 5 5.02 5.10 4.82 6 6.02 5.94 8 8.04 7.90 PSNR eya ecw RMSE sid eya ecw sid 2.35 48.4205 41.8586 48.10647 0.9672 2.0588 1.0028 1.03 2.30 41.3593 39.1577 41.39581 2.1806 2.8097 2.1714 1.41 1.14 2.15 36.8286 33.0567 35.9741 3.6737 5.6716 4.0535 5.80 1.37 1.12 2.00 35.1108 32.4207 34.6157 4.4771 6.1025 4.7397 7.29 1.32 1.08 1.57 33.7138 31.3018 32.9444 5.2583 6.9414 5.7453 10 10.02 10.20 9.04 1.27 1.00 2.00 32.6247 30.4872 32.2708 6.8008 7.6239 6.2086 15 15.01 16.60 14.70 1.21 0.53 1.57 31.4796 29.2395 31.3323 5.9607 8.8017 6.9171 20 20.01 22.80 18.60 1.18 1.13 1.35 30.4411 28.5329 29.9800 7.6645 9.5476 8.0823 25 25.02 30.00 22.27 1.23 1.33 1.47 30.4411 27.8899 29.0786 7.6645 10.2812 8.9662 30 30.01 36.20 27.57 1.22 1.32 1.35 28.8783 27.4549 28.5377 9.1753 10.8093 9.5423 50 50.02 57.90 44.42 1.23 1.24 1.27 27.6508 26.5622 27.3341 10.5681 11.9793 10.9606 Table1. Test data table obtained from the test. The rate stands for the target compression rate and the actual rate stands for the program’s actual compression rate corresponding to the given target compression rate. 254 Jingwei LI & Yousong ZHAO 2 3 5 6 8 10 15 20 25 30 50 100 Original image Image_O 2.5 eya_time ecw_time sid_time 1.5 time(m,s) Compressor 2.0 1.0 Compressed Image Image_Cn 0.5 0.0 compress_ratio Decompressor Figure 2. Comparison of compress time Reconstructed Image Image_OCn 3.2 Compression Rate As we know, different compressors take the different output as their tradeoff, for example, output size or output quality. What the compressors do is to adjust the compression rate to guarantee a quality during compression. This is the reason why the target compression rate is not same as the actual compression rate after the image compression. Figure3 shows that the absolute error of EYA between the target compression rate and the actual compression rate is 0.05. Whatever we try, the actual compression rate is always larger than what the user specified. PSNR Image_O - Image_0Cn Test Data Analysis Table2 shows that EYA and MrSID is better than ECW in doing compression work when the target compression rate is less than 3. Test Result Figure 1. Work chart of the test 2 3 5 6 8 10 15 20 25 30 50 8.0 eya_rr-gr 3. ANALYSIS 6.0 ecw_rr_gr 4.0 sid_rr_gr 2.0 difference 3.1 Compression Time The figure2 below shows the compression time according the target compression rate. In the average, the time used by MiSID is about 2 minutes and 16 seconds; EYA is about 1 minute and 32 seconds; ECW is about 1 minute and 8 seconds. The test result shows that ECW compressed twice as fast as MrSID. 0.0 -2.0 given compression ratio -4.0 -6.0 Figure 3. Comparison of compress rate The number of changed pixels when the target The number of changed pixels when the target compression rate is 2 compression rate is 3 value ECW_pn EYA_pn SID_pn ECW_pn EYA_pn SID_pn 0 17187464 37855878 35279294 12922936 21852369 18150880 1 29257077 40760961 40642912 22589995 30925332 27324893 2 20752410 7373864 9726001 18591521 17310397 19876016 3 11741970 389290 782872 13779578 8222950 11905358 Total 78938921 86379993 86431079 67884030 78311048 77257147 Ratio 0.913089 0.99916 0.999751 0.785217 0.905826 0.893636 Table 2. The changed amount of the pixel’s gray value in the reconstructed image compared with the original image when the target compression rate is 2 and 3. Ratio can be got from dividing Total of the table by 86452608 (9312×9284) which is the total pixel number of the test image. 255 IAPRS, VOLUME XXXIV, PART2, COMMISSION II, Xi’an, Aug. 20-23, 2002 Figure 4 clearly compares the relations by the amount of changed pixels in the different reconstructed image by different compressors, corresponding to changed pixel gray value being 0, 1, 2, 3and the rest respectively. 2 3 5 ECW 8 10 15 20 25 30 50 12 eya rmse EYA 6 ecw rmse sid rmse 10 SID 8 100% 80% 6 rmse 60% 40% 4 20% 2 0% 其它 3 2 1 0 1 2 3 0.08% 0.45% 8.53% 47.15% 43.79% 8.69% 13.58% 24.00% 33.84% 19.88% 0.02% 0.91% 11.25% 47.01% 40.81% Figure 6. Comparison of the RMSE 4. SUGGESTION Figure 4. Comparison of the changed pixel’ value when the target compress rate is 2. EYA is developed by the private people, and it can only be used independently and can not be embed in other software systems. But the selling price is very cheap. 3.3 Reconstructed Image Quality The result of the comparison of PSNR is that EYA is 34.268, MrSID is 33.779, and ECW is 31.633, in average. The RMSE corresponding to EYA, MrSID, ECW, is 5.854, 6.217 and 7.512, respectively. Figure 5 and 6 shows the details. 2 3 5 6 8 10 15 0 given compression ratio ECW is an open Standard for both compression and decompression and compression and serving of large imagery opens up exciting capabilities to GIS, CAD, OFFICE, and web users. They have released both decompression and compression ECW software development kits for ECW, as well as free ECW utilities (with 500 MB limit on input image size; $4,995 for the full ERMapper GIS and unlimited image size) and application plug-ins. 20 50 45 eya_psnr ecw_psnr sid_psnr MrSID is the industry standard for encoding and viewing massive raster images in the Geospatial community, and most of the mainstream applications have enabled MrSID viewing technology. The MrSID was sold at $1, 500 for the version with a 500 MB file size limit and $5,000 for the version with unlimited image size and free applications plug-ins were also provided. 40 35 psnr 30 25 20 The table 3 below lists some important factors for selecting the compressors to do the project. We suggest that EYA and MrSID should be selected to do the image compression when the target compression rate is less than 3. When the target compression rate is getting larger, the effect of the compressed image by different compressors does not have the big difference in viewing, one of the compressors can be selected according to the table 3. 15 10 5 0 compress_ratio Figure 5. Comparison of the PSNR Compression time 1 2 3 EYA 2 MrSID ECW 3 1 Compression rate 1 2 3 Compression quality 1 2 3 1 1 1 1 2 Price 2 2 3 3 3 Table 3. Ordinal number table obtained according to the compressor’s function 256 3 2 Jingwei LI & Yousong ZHAO REFERENCE G. Strang, Wavelets, 1992. American Scientist, Vol. 82, pp. 250-255. LI Qiang, WANG Zheng-Zhi, 2000. A Compression Method for Remote Sensing Image[J], Journal of Remote Sensing. Mitchell J. L., Pennebaker W.B., C. E. Fogg, and D. J. LeGall, 1997. MPEG Video Compression Standard , New York: Chapman & Hall. Robi Polokar, The Wavelet Tutorial. http://engineering.rowan.edu/~polikar/WAVELETS/WTtutorial .html Steve Wallace, Image Compression Software. http://www.directionsmag.com. ZHANG Rong, LIU Zheng-kai, ZAN Shu, 2000 .Wavelet-based Compression for Multispectral Imagery [J], Journal of Remote Sensing . 257 IAPRS, VOLUME XXXIV, PART2, COMMISSION II, Xi’an, Aug. 20-23, 2002 258


