Assessment of Socioeconomic Rating Indicators of the Sabitova N.M.
advertisement
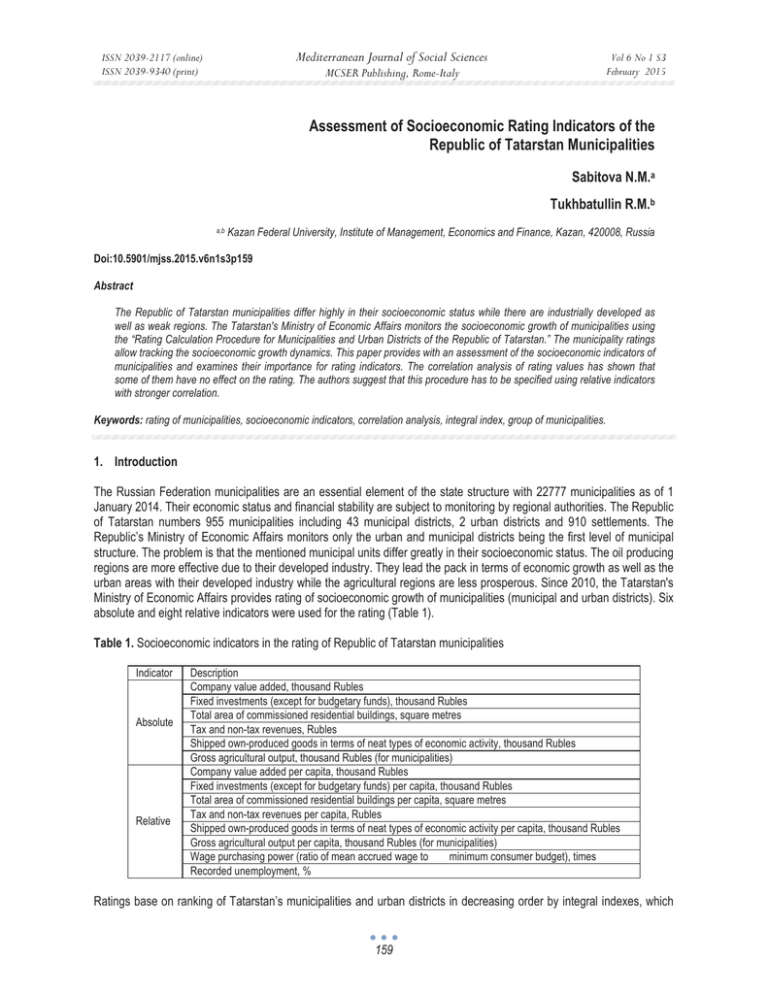
Mediterranean Journal of Social Sciences ISSN 2039-2117 (online) ISSN 2039-9340 (print) Vol 6 No 1 S3 February 2015 MCSER Publishing, Rome-Italy Assessment of Socioeconomic Rating Indicators of the Republic of Tatarstan Municipalities Sabitova N.M.a Tukhbatullin R.M.b a,b Kazan Federal University, Institute of Management, Economics and Finance, Kazan, 420008, Russia Doi:10.5901/mjss.2015.v6n1s3p159 Abstract The Republic of Tatarstan municipalities differ highly in their socioeconomic status while there are industrially developed as well as weak regions. The Tatarstan's Ministry of Economic Affairs monitors the socioeconomic growth of municipalities using the “Rating Calculation Procedure for Municipalities and Urban Districts of the Republic of Tatarstan.” The municipality ratings allow tracking the socioeconomic growth dynamics. This paper provides with an assessment of the socioeconomic indicators of municipalities and examines their importance for rating indicators. The correlation analysis of rating values has shown that some of them have no effect on the rating. The authors suggest that this procedure has to be specified using relative indicators with stronger correlation. Keywords: rating of municipalities, socioeconomic indicators, correlation analysis, integral index, group of municipalities. 1. Introduction The Russian Federation municipalities are an essential element of the state structure with 22777 municipalities as of 1 January 2014. Their economic status and financial stability are subject to monitoring by regional authorities. The Republic of Tatarstan numbers 955 municipalities including 43 municipal districts, 2 urban districts and 910 settlements. The Republic’s Ministry of Economic Affairs monitors only the urban and municipal districts being the first level of municipal structure. The problem is that the mentioned municipal units differ greatly in their socioeconomic status. The oil producing regions are more effective due to their developed industry. They lead the pack in terms of economic growth as well as the urban areas with their developed industry while the agricultural regions are less prosperous. Since 2010, the Tatarstan's Ministry of Economic Affairs provides rating of socioeconomic growth of municipalities (municipal and urban districts). Six absolute and eight relative indicators were used for the rating (Table 1). Table 1. Socioeconomic indicators in the rating of Republic of Tatarstan municipalities Indicator Absolute Relative Description Company value added, thousand Rubles Fixed investments (except for budgetary funds), thousand Rubles Total area of commissioned residential buildings, square metres Tax and non-tax revenues, Rubles Shipped own-produced goods in terms of neat types of economic activity, thousand Rubles Gross agricultural output, thousand Rubles (for municipalities) Company value added per capita, thousand Rubles Fixed investments (except for budgetary funds) per capita, thousand Rubles Total area of commissioned residential buildings per capita, square metres Tax and non-tax revenues per capita, Rubles Shipped own-produced goods in terms of neat types of economic activity per capita, thousand Rubles Gross agricultural output per capita, thousand Rubles (for municipalities) Wage purchasing power (ratio of mean accrued wage to minimum consumer budget), times Recorded unemployment, % Ratings base on ranking of Tatarstan’s municipalities and urban districts in decreasing order by integral indexes, which 159 ISSN 2039-2117 (online) ISSN 2039-9340 (print) Mediterranean Journal of Social Sciences MCSER Publishing, Rome-Italy Vol 6 No 1 S3 February 2015 are calculated in several steps. In the first step, the numerical values of direct and reciprocal indicators are converted into normalised values, and then a sum of normalised indicators with absolute and relative values shall be determined for each municipality of the Republic of Tatarstan. Further, the normalised indicators without absolute values are added to the normalised indicators with both the absolute and the relative values. At the last stage, a composite index will be determined for ranking: the municipality with the highest index value should head the list while the municipality with the lowest index occupies the last position in the rating. Table 2 lists municipalities rated by the Republic of Tatarstan Ministry of Economic Affairs in 2013. Table 2. Rating of socioeconomic growth of municipal and urban districts of the Republic of Tatarstan in 2013. Position 1 2 3 4 5 6 7 8 9 10 11 12 13 14 15 16 17 18 19 20 21 22 23 Municipality Kazan Almetievskiy Laishevskiy Tukayevskiy Nizhnekamskiy Naberezhnye Chelny Novosheshminskiy Pestrechinskiy Mendeleyevskiy Tyulyachinskiy Yelabuzhskiy Vysokogorskiy Aznakayevskiy Leninogorskiy Aktanyshskiy Nurlatskiy Bugulminskiy Verkhneuslonskiy Sarmanovskiy Zelenodolskiy Zainskiy Buinskiy Sabinskiy Position 24 25 26 27 28 29 30 31 32 33 34 35 36 37 38 39 40 41 42 43 44 45 x Municipality Bavlinskiy Kaibitskiy Yutazinskiy Menzelinskiy Kamsko-Ustienskiy Agryzskiy Cheremshanskiy Apastovskiy Atninskiy Muslyumovskiy Alkeyevskiy Mamadyshskiy Kukmorskiy Arskiy Baltasinskiy Alekseyevskiy Drozhzhanovskiy Aksubayevskiy Rybno-Slobodskiy Chistopolskiy Spasskiy Tetyushskiy x Analysis of these data shows that the rating performed using the above procedure does not support our hypothesis that urban districts and oil-producing areas will be within the top ten. Such agricultural areas as Laishevskiy, Pestrechinskiy and Tyulyachinskiy are within the top ten while the majority of oil-producing regions such as Aznakayevskiy, Leninogorskiy, Nurlatskiy, Bugulminskiy, Sarmanovskiy, Zainskiy and others are far beyond the top tens. Therefore, we judge the procedure itself and determine the magnitude of the indicators used in the rating procedure. 2. Theory The experience of other countries to monitor the socioeconomic growth of municipalities was examined when writing this paper. Monitoring of the municipalities is described in the papers of such authors as Donaldson, R., van Niekerk, A., du Plessis, D., Spocter, M. They emphasize the key values for determination of the growth capacity of the Western Cape municipalities (Republic of South Africa) and divided municipalities in three categories: with high, middle and low growth capacity [1]. Novak, J., Netrdova, P. described cluster analysis, which identified spatial regularities in socioeconomic differentiation of municipalities in Czech Republic [6]. Grigoryeva, N., Kundukchyan, R. provide values that had significant effect on the innovation activity of the regions, which they have found through the econometrical analysis [4]. Interesting is the comparative assessment procedure for the socioeconomic growth of cities and municipalities provided by Panasyuk, M.V. [7]. The following authors studied the problems of socioeconomic growth of regions: Vladyslavovych, S.V. [11], Mashunin, Yu.K., Mashunin, I.A. [5], Gainova, R.A., Shaidullin, R.N., Safiullin, L.N. [3], while Stepanovich, B.V. [10], Draci, B., Caro, D., Nikolli, P. [2], Salvati, L [9], Pastor, E.M.C., García, J.H., Gavilan, M.D.S. [8] et al. examined the matter at the municipal level. This and other papers may be useful for drafting and updating the municipality assessment 160 Mediterranean Journal of Social Sciences ISSN 2039-2117 (online) ISSN 2039-9340 (print) MCSER Publishing, Rome-Italy Vol 6 No 1 S3 February 2015 and monitoring procedure. 3. Results For the determination of how the correlation of the rating with absolute and relative socioeconomic indicators for the Republic’s municipalities was assessed, we have performed a correlation analysis of indicators, which then was used by the Republic of Tatarstan Ministry of Economic Affairs. The objective of the analysis was to identify whether the inclusion of some or other indicator into the rating is practical. The results of the correlation analysis are given in Table 3. Table 3. Correlation between the rating and absolute and relative socioeconomic indicators of Tatarstan’s municipalities in 2013 Correlation High Upper Middle Middle Low Description Wage purchasing power (ratio of mean accrued wage to minimum consumer budget), times Tax and non-tax revenues per capita, Rubles Fixed investments (except for budgetary funds), thousand Rubles Company value added, thousand Rubles and company value added per capita, thousand Rubles Shipped own-produced goods in terms of neat types of economic activity, thousand Rubles and shipped own-produced goods in terms of neat types of economic activity per capita, thousand Rubles Total area of commissioned residential buildings, square metres and total area of commissioned residential buildings per capita, square metres Recorded unemployment, % Tax and non-tax revenues, thousand Rubles Fixed investments (except for budgetary funds) per capita, thousand Rubles Gross agricultural output, thousand Rubles and gross agricultural output per capita, thousand Rubles The correlation analysis has shown that the rating had the highest correlation with the wage purchasing power and it correlated well with the tax and non-tax revenues per capita and fixed investments (except for budgetary funds). The gross agricultural output in absolute values per capita does not correlate with the rating. Therefore, we think that these data should be ignored for calculations, as they have no effect on the rating positions. We feel that such indicators as the gross territorial product in absolute values and per capita as well as the industrial production index should be added to the rating. This will provide with an accurate and actual information on socioeconomic status of the Republic’s municipalities. The coefficients of variations were found for determination of variability or spread in rating indicators. Only two of 14 indicators have acceptable variation (i.e. totally, data are uniform) – these are the wage purchasing power and tax and non-tax revenues per capita. The recorded unemployment may be considered close to the acceptable variation. Other indicators are highly spread in values suggesting strong differentiation of socioeconomic growth of Republic’s municipalities. We grouped the municipalities depending on their socioeconomic level. Integral indexes were calculated for rating indicators using a procedure provided by the Republic of Tatarstan Ministry of Economic Affairs. Then we determined the optimum number of groups, interval lengths and constructed interval distribution series for integral indexes, based on which the municipalities were grouped (Table 4). Table 4. Municipalities against their socioeconomic growth for 2013 Level of growth Very High High Upper Middle Middle Lower Middle Low Municipality Kazan Almetievskiy, Laishevskiy, Tukayevskiy Nizhnekamskiy, Naberezhnye Chelny, Novosheshminskiy Pestrechinskiy, Mendeleyevskiy, Tyulyachinskiy, Yelabuzhskiy, Vysokogorskiy Aznakayevskiy, Leninogorskiy, Aktanyshskiy, Nurlatskiy, Bugulminskiy, Verkhneuslonskiy, Sarmanovskiy, Zelenodolskiy, Zainskiy, Buinskiy, Sabinskiy, Bavlinskiy, Kaibitskiy, Yutazinskiy, Menzelinskiy, Kamsko-Ustienskiy, Agryzskiy, Cheremshanskiy, Apastovskiy, Atninskiy, Muslyumovskiy, Alkeyevskiy Mamadyshskiy, Kukmorskiy, Arskiy, Baltasinskiy, Alekseyevskiy, Drozhzhanovskiy, Aksubayevskiy, Rybno-Slobodskiy, Chistopolskiy, Spasskiy, Tetyushskiy 161 ISSN 2039-2117 (online) ISSN 2039-9340 (print) Mediterranean Journal of Social Sciences MCSER Publishing, Rome-Italy Vol 6 No 1 S3 February 2015 The averaged integral indexes of absolute and relative socioeconomic indicators are calculated for rating the municipalities according to the Republic of Tatarstan Ministry of Economic Affairs procedure. The averaging resulted in more developed and inhabited municipalities having higher integral index values due to higher absolute indicator values. Otherwise, less developed and sparsely populated municipalities become lower integral indexes due to lower absolute indicator values. It results in inequality of assessment conditions, as the sparsely populated municipalities usually cannot compete with the densely populated municipalities in terms of absolute indicator values. If the rating were built according to the economic and industrial development, the absolute values would play a key role. However, social factors, which assessment requires values per capita, are important for rating the socioeconomic growth. Therefore, we think that the rating of municipalities should base on the relative indicators only. Table 5 groups the municipalities against their socioeconomic development based on relative indicators only. Table 5. Municipalities against their socioeconomic growth for 2013 (relative indicators only) Level of growth Very High High Upper Middle Middle Lower Middle Low Municipality Laishevskiy, Tukayevskiy, Almetievskiy Novosheshminskiy Kazan, Nizhnekamskiy, Pestrechinskiy, Mendeleyevskiy Tyulyachinskiy, Verkhneuslonskiy, Ⱥɡɧɚɤɚɟɜɫɤɢɣ, Yelabuzhskiy, Vysokogorskiy, Nurlatskiy, Leninogorskiy, Aktanyshskiy, Naberezhnye Chelny, Sarmanovskiy, Sabinskiy, Bugulminskiy, Bavlinskiy, Zainskiy Cheremshanskiy, Yutazinskiy, Buinskiy, Kamsko-Ustienskiy, Zelenodolskiy, Kaibitskiy, Menzelinskiy, Agryzskiy, Apastovskiy, Atninskiy, Alkeyevskiy, Alekseyevskiy, Muslyumovskiy, Mamadyshskiy Kukmorskiy, Arskiy, Baltasinskiy, Aksubayevskiy, Drozhzhanovskiy, Chistopolskiy, Spasskiy, Rybno-Slobodskiy, Tetyushskiy Thus, the socioeconomic growth of municipalities grouped in Table 5 by their relative parameters can be more accurately assessed, because their population size is taken into account. 4. Conclusions The analysis of the Republic of Tatarstan municipality socioeconomic growth rating procedure used by the Ministry of Economic Affairs needs to be updated, which is supported by the correlation analysis of rating indicators and the rating itself. The problem is that the municipalities differ highly in their socioeconomic development; therefore, absolute indicators are poorly linked to the rating. In addition, the correlation analysis has shown that the rating should neglect absolute and relative indicators of gross agricultural output since their relation to the rating is low. We suggest rating the Republic of Tatarstan municipalities using relative indicators only for more valid assessment of their socioeconomic growth. It is a good practice for the municipality socioeconomic growth assessment procedure to include the characteristics of the region, where municipalities are located. Being an oil-producing region, the Republic of Tatarstan has its own particular characteristics in terms of differentiation of areas; therefore, from our point of view, these characteristics should be considered in the municipality socioeconomic growth assessment procedure. References Donaldson, R., van Niekerk, A., du Plessis, D., Spocter, M. 2012. Non-metropolitan Growth Potential of Western Cape Municipalities // Urban Forum. Volume 23 (3), pp. 367-389. I.Sh. Khasanov, Three-sector structure of the national economy of Russia // Asian Social Science, Volume 10, 2014, Pages 217-224. Kramin, M. V., Safiullin, L. N., Kramin, T. V., & Timiryasova, A. V. (2014). Drivers of economic growth and investment attractiveness of Russian regions. Life Science Journal, 11(6s). Gainova, R.A., Shaidullin, R.N., Safiullin, L.N. 2013. Infrastructural component in maintenance of competitiveness of region // World Applied Sciences Journal. Volume 27 (13), pp. 97-101. Grigoryeva, N., Kundukchyan, R. 2014. Econometric modelling of indicators of innovation activity level // American Journal of Applied Sciences. Volume 11 (9), pp. 1579-1583. Mashunin, Yu.K., Mashunin, I.A. 2014. Forecasting the development of regional economy on the basis of input - Output tables // Economy of Region. Issue 2, pp. 276-289. Novak, J., Netrdova, P. 2011. Spatial patterns of socioeconomic differentiation in the Czech republic at the level of municipalities // 162 ISSN 2039-2117 (online) ISSN 2039-9340 (print) Mediterranean Journal of Social Sciences MCSER Publishing, Rome-Italy Vol 6 No 1 S3 February 2015 Sociologicky Casopis. Volume 47 (4), pp. 717-744. Pastor, E.M.C., García, J.H., Gavilan, M.D.S. 2010. Statistic analysis of the socioeconomic context in Andalusia. An approach at municipal level // Investigaciones Regionales. Issue 18, pp. 107-138. Varlamova J.A., Larionova N.I. Economic behavior of households: cross-country comparison. Life Science Journal 2014; 11(6s): 409– 413. Salvati, L. 2014. Towards a Polycentric Region? The Socio-economic Trajectory of Rome, an 'Eternally Mediterranean' City // Tijdschrift voor Economische en Sociale Geografie. Volume 105 (3), pp. 268-284. Stepanovich, B.V. 2014. Development of territories of municipal formations with use of a program method // Economy of Region. Issue 1, pp. 33-43. Vladyslavovych, S.V. 2014. The effectiveness of regional economic development: Opportunities in the structure of the federal district // Economy of Region. Volume 37 (1), pp. 84-93. 163
