ANALYSIS OF SOFTWARE REQUIREMENTS TO REPRESENT URBAN AREAS WITH DEM’S... VISUALIZATION OF BUILDINGS AND STRUCTURES
advertisement

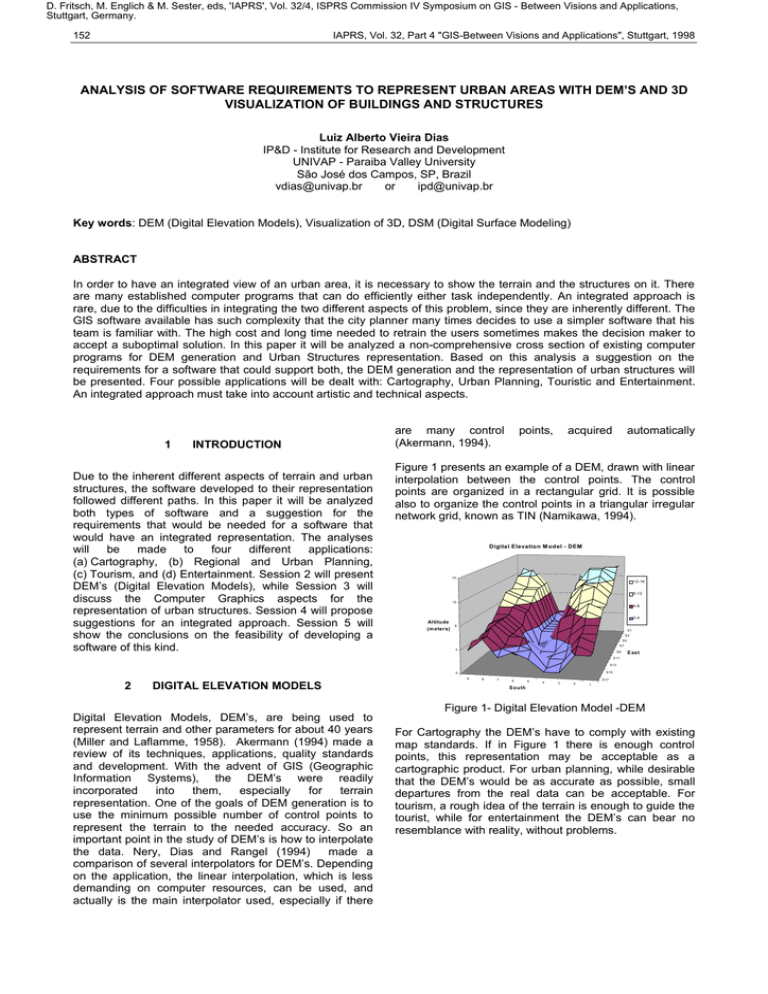
D. Fritsch, M. Englich & M. Sester, eds, 'IAPRS', Vol. 32/4, ISPRS Commission IV Symposium on GIS - Between Visions and Applications, Stuttgart, Germany. 152 IAPRS, Vol. 32, Part 4 "GIS-Between Visions and Applications", Stuttgart, 1998 ANALYSIS OF SOFTWARE REQUIREMENTS TO REPRESENT URBAN AREAS WITH DEM’S AND 3D VISUALIZATION OF BUILDINGS AND STRUCTURES Luiz Alberto Vieira Dias IP&D - Institute for Research and Development UNIVAP - Paraiba Valley University São José dos Campos, SP, Brazil vdias@univap.br or ipd@univap.br Key words: DEM (Digital Elevation Models), Visualization of 3D, DSM (Digital Surface Modeling) ABSTRACT In order to have an integrated view of an urban area, it is necessary to show the terrain and the structures on it. There are many established computer programs that can do efficiently either task independently. An integrated approach is rare, due to the difficulties in integrating the two different aspects of this problem, since they are inherently different. The GIS software available has such complexity that the city planner many times decides to use a simpler software that his team is familiar with. The high cost and long time needed to retrain the users sometimes makes the decision maker to accept a suboptimal solution. In this paper it will be analyzed a non-comprehensive cross section of existing computer programs for DEM generation and Urban Structures representation. Based on this analysis a suggestion on the requirements for a software that could support both, the DEM generation and the representation of urban structures will be presented. Four possible applications will be dealt with: Cartography, Urban Planning, Touristic and Entertainment. An integrated approach must take into account artistic and technical aspects. 1 INTRODUCTION Due to the inherent different aspects of terrain and urban structures, the software developed to their representation followed different paths. In this paper it will be analyzed both types of software and a suggestion for the requirements that would be needed for a software that would have an integrated representation. The analyses will be made to four different applications: (a) Cartography, (b) Regional and Urban Planning, (c) Tourism, and (d) Entertainment. Session 2 will present DEM’s (Digital Elevation Models), while Session 3 will discuss the Computer Graphics aspects for the representation of urban structures. Session 4 will propose suggestions for an integrated approach. Session 5 will show the conclusions on the feasibility of developing a software of this kind. are many control (Akermann, 1994). points, acquired automatically Figure 1 presents an example of a DEM, drawn with linear interpolation between the control points. The control points are organized in a rectangular grid. It is possible also to organize the control points in a triangular irregular network grid, known as TIN (Namikawa, 1994). Digital Elevatio n M od el - DEM 16 1 2-16 8 -12 12 4 -8 0 -4 Altitude (m eters) 8 S1 S3 S5 S7 4 S9 E ast S 11 S13 S15 0 9 2 DIGITAL ELEVATION MODELS Digital Elevation Models, DEM’s, are being used to represent terrain and other parameters for about 40 years (Miller and Laflamme, 1958). Akermann (1994) made a review of its techniques, applications, quality standards and development. With the advent of GIS (Geographic Information Systems), the DEM’s were readily incorporated into them, especially for terrain representation. One of the goals of DEM generation is to use the minimum possible number of control points to represent the terrain to the needed accuracy. So an important point in the study of DEM’s is how to interpolate the data. Nery, Dias and Rangel (1994) made a comparison of several interpolators for DEM’s. Depending on the application, the linear interpolation, which is less demanding on computer resources, can be used, and actually is the main interpolator used, especially if there 8 7 6 S outh 5 4 S17 3 2 1 Figure 1- Digital Elevation Model -DEM For Cartography the DEM’s have to comply with existing map standards. If in Figure 1 there is enough control points, this representation may be acceptable as a cartographic product. For urban planning, while desirable that the DEM’s would be as accurate as possible, small departures from the real data can be acceptable. For tourism, a rough idea of the terrain is enough to guide the tourist, while for entertainment the DEM’s can bear no resemblance with reality, without problems. D. Fritsch, M. Englich & M. Sester, eds, 'IAPRS', Vol. 32/4, ISPRS Commission IV Symposium on GIS - Between Visions and Applications, Stuttgart, Germany. Dias 153 3 COMPUTER GRAPHICS FOR URBAN STRUCTURES REPRESENTATION The urban structures can be represented in computers by means of Computer Graphics. A basic and comprehensive text on this subject is Foley, Van Dam, Feiner, and Hughes (1992). Meister and Dan (1994) used the AutoCAD program to insert into DEM simple buildings. However, the buildings had some limitations, like the need to have vertical walls and the limitation that the area of the roof could not be projected outside the area formed by the vertical walls. GIS (Geographic Information System) programs. Almost all GIS programs now incorporate DEM’s, and so are perfectly capable of representing terrains, but have difficulties with drawing artificial structures over it. The present situation is that, for Mapping and Regional and Urban Planning, programs for GIS and DEM are used, while for Tourism and Entertainment Computer Graphics programs are favored. This paper will present suggestions for the requirements of a program that could treat terrain and structures. Figure 3, below, shows an old railroad station drawn with AutoCAD. A terrain can be represented fairly well by a DEM, but artificial structures like bridges, buildings, factories, and other, require a much more sophisticated representation. While simple structures like a building or a bridge may be drawn (generalized) as wire framed objects, in order to be realistically represented, it is necessary to consider, besides their shape, hidden lines, illumination, and even the texture of their parts (stone, wood, cement, glass, etc). Figure 3 – Old railroad station. Source: Fabio de Almeida, Brazil. Figure 2 Figure 2 shows the representation of a building (house), using the computer drawing program PAINT. Of course, while for Cartography this representation is unsatisfactory, for Tourism or Entertainment it may be acceptable. In order to be inserted into a cartographic product, the house of Figure 2 must have accurate measurements, compatible with the map scale. Also, it must have been drawn in such a way as that it could be scaled, rotated and twisted to fit the map projection. The program PAINT can not perform all these tasks. Actually the house should have been drawn by a program with those capabilities, like AutoCAD. AutoCAD (see Figure 3) allows the object to be drawn in 3 dimensions, be rotated, scaled and twisted. Of course, depending on the scale of the map, a house will be represented by only by a small square (see Figure 4), as is the rule for 1:10000 scale maps. On regional level maps individual houses are simply not shown. In Figure 3 it is possible to see that not only the wire frame is shown, but also illumination, texture, and perspective. It is possible to observe the shadows and, if one wants, to animate the object. The problem with AutoCAD, and many other architectural programs is that since they use Computer Graphics techniques, they can not easily merge the drawings with Note the wireframe structure shown in part of the structure, and the shadows, illumination, perspective, and texture on the rest of the drawing. This image is a courtesy of Fabio de Almeida (1997), an Architect of São José dos Campos, SP, Brazil, who draw in AutoCAD many historical buildings on that Municipality, and produced a CD-ROM with them. 4 SOFTWARE FOR INTEGRATING DEM AND COMPUTER GRAPHICS FOR 3D URBAN MAPS As seen form Figure 4, for regional scale maps it is not necessary to depict artificial structures like buildings, bridges, etc, except as symbols. However, if one wants to present a detailed 3D map of an urban Area, it is interesting that the above mentioned structures could be shown in realistic detail, if the map scale would permit it. Four types of applications will be analyzed: (a) Cartography, (b) Regional and Urban Planning, (c) Tourism, and (d) Entertainment. Each of these applications have different needs. For Cartography, the amount of data needed for an accurate representation of city blocks in 3D with buildings and other equipment is enormous. On 1:2000 scale, aerial photography and ground measurements are necessary to gather the input data. D. Fritsch, M. Englich & M. Sester, eds, 'IAPRS', Vol. 32/4, ISPRS Commission IV Symposium on GIS - Between Visions and Applications, Stuttgart, Germany. 154 IAPRS, Vol. 32, Part 4 "GIS-Between Visions and Applications", Stuttgart, 1998 Figure 4- Portion of a cartographic map of Vienna (Wien), Austria on 1:10000 scale. Note the individual structures drawn as small squares. Source: Donauraum in Österreich, Donaukraft, Östereich Donaukraftwerke AG. If the goal is Regional Planning (1:50000 scale) the input data can be from satellite images, like SPOT and LANDSAT. In this case it is not necessary many details about the artificial structures. Tourism probably is the main application for 3D maps. The tourist will need a pictorial view of the city he is on, possibly for the first time. In Entertainment, which is the most profitable application, the Computer Graphics aspect is stressed. In games like Simmcity, and Red Alert, just to mention a few, there is a blend between the terrain and the structures. However this is achieved by means of pure Computer Graphics, and probably a map revision, necessary for Tourism, Regional and Urban Planning and Cartography would not be easily performed. As far as requirements for an integrated program, the following aspects should be listed: x The program should be able to draw a DEM from control points. The ideal would be if different interpolators would be available. x The program should have a library of urban structures plus the ability to draw new structures if they are not available in the library. x These structures should be realistic enough in order to be able to present illumination (from a virtual Sun, including with change in elevation and azimuth for the desirable site). x The structures must be independent objects, that could be inserted and/or removed and/or moved from their locations on the DEM. x Should be possible to associate a data bank to the objects (structures). Based on the above considerations, it is clear that in order to comply with all those demands the proposed software has to be of the Computer Graphics type, not GIS type. 5 CONCLUSIONS The GIS programs have an important limitation: they can not represent easily 3D drawings. That is the reason why a software to be able to draw DEM’s and the associated urban structures capabilities. must have Computer Graphics The author believes that in order to integrate DEM’s with urban structures it is necessary to use Computer Graphics type programs. These programs have trouble in dealing with terrain descriptions, so the proposed software should improve that capability. It is belived that it is easier to do that than introduce Computer Graphics capabilities in the present GIS programs. The final result would be like Figure 5, taken from a touristic map of Vienna, from Freytag and Berndt Maps, Vienna, Austria, except that the drawings would be made by computer, and not by hand from aerial photographs. Since the drawings would be made by Computer Graphics, it would be easy to show the solar illumination, and change the viewer position. Also the terrain altitude could be depicted. In the limit it would be possible to “drive” through the city in a virtual vehicle. Figure 5 – Three dimensional map of the center of Vienna There is no reason (except the high cost) that would not allow that a map like that could be produced with cartographic accuracy. So depending on the application the costs would be lower, in the following order: cartography o urban planning o tourism. For entertainment the data gathering is not necessary, so the costs would be even smaller. It should be noticed that it is very important the artistic side of the production of these maps. A software to D. Fritsch, M. Englich & M. Sester, eds, 'IAPRS', Vol. 32/4, ISPRS Commission IV Symposium on GIS - Between Visions and Applications, Stuttgart, Germany. Dias 155 generate 3D maps, that may include animation, must provide facilities for the proper use of a variety of fonts, sizes and colors. The user must use the colors in a artistic way, otherwise the result could be scientifically correct, but not pleasant. At the time of this writting – 1998 – the personal computers still have to be improved to deal with the large amount of data processing that the graphics in the proposed program would demand. Even on the requirements side, there is much more work to be done. It is believed, however, that such proposed software could be developed with the present technology. 6 BIBLIOGRAPHY AKERMANN, F. Digital Elevation Models – Techniques and Application, Quality Standards, Development. International Archives of Photogrammetry and Remote Sensing, vol 30 (4), pg 421-432, 1994. ALMEIDA, F. Acervo Arquitetônico (in Portuguese). CDROM with historical buildings of São José dos Campos, SP, Brazil. E-mail address: simutron@netvale.com.br (1997) FOLEY, J.D.; VanDAM, A.; FEINER, S. K.; HUGHES, J. F. Computer Graphics – Principles and Practice. 2nd Edition. Reading, MA, USA: Addison-Wesley, 1992. MEISTER, M.; DAN, H. Processing of Geographic Data for CAAD-Supported Analysis and Design of Urban Areas. International Archives of Photogrammetry and Remote Sensing, vol 30 (4), pg 433-440, 1994. MILLER, C. L.; LaFLAMME,R. A. The Digital Terrain model – Theory and Application. Photogrammetric Engineering and Remote Sensing, vol 24, pg 433442, 1958. NAMIKAWA, L. M. A Method for Triangular Grid Surface Fitting Using Break Lines. International Archives of Photogrammetry and Remote Sensing, vol 30, pg 362-368, 1994. NERY, C. E.; DIAS, L. A. V.; RANGEL, R. R. Digital Elevation Models Interpolated by Linear, Akima and Beta-Spline Methods: a Comparison. International Archives of Photogrammetry and remote Sensing, vol 30, pg 416-420, 1994. 7 ACKNOWLEDGEMENTS The author would like to thank the IP&D, Institute for Research and Development of UNIVAP, Paraíba Valley University, São José dos Campos, SP, Brazil for support during the research; and FAPESP, São Paulo State Foundation for Research Support, São Paulo, SP, Brazil, for travel support.


