SENSOR MODEL EVALUATION AND
advertisement
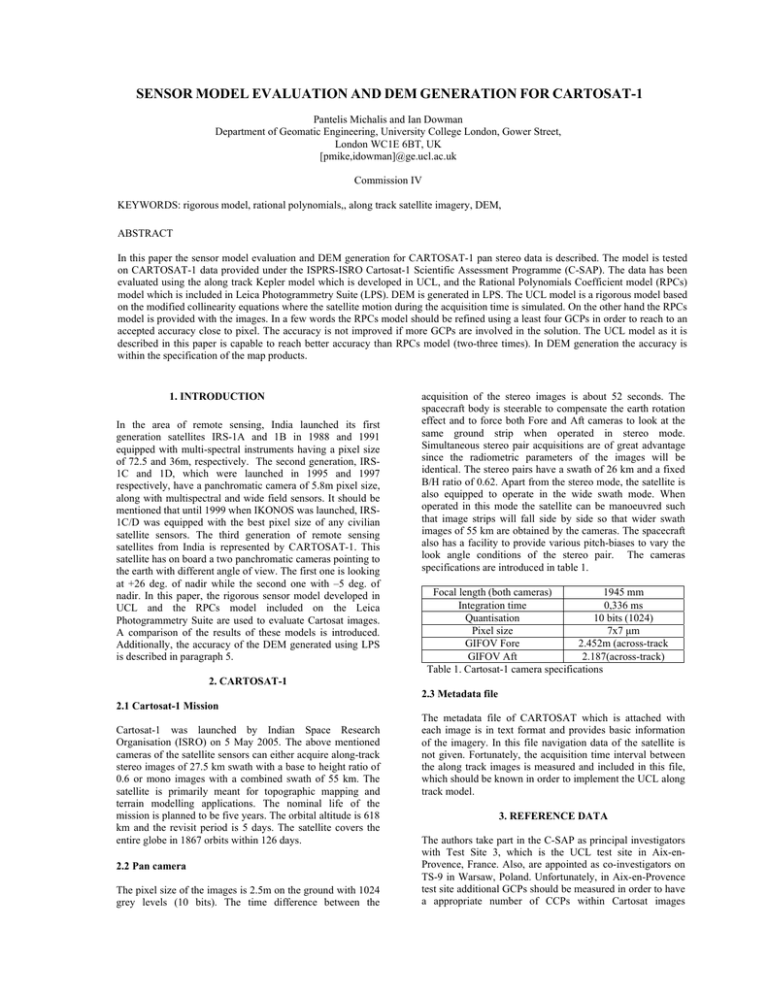
SENSOR MODEL EVALUATION AND DEM GENERATION FOR CARTOSAT-1 Pantelis Michalis and Ian Dowman Department of Geomatic Engineering, University College London, Gower Street, London WC1E 6BT, UK [pmike,idowman]@ge.ucl.ac.uk Commission IV KEYWORDS: rigorous model, rational polynomials,, along track satellite imagery, DEM, ABSTRACT In this paper the sensor model evaluation and DEM generation for CARTOSAT-1 pan stereo data is described. The model is tested on CARTOSAT-1 data provided under the ISPRS-ISRO Cartosat-1 Scientific Assessment Programme (C-SAP). The data has been evaluated using the along track Kepler model which is developed in UCL, and the Rational Polynomials Coefficient model (RPCs) model which is included in Leica Photogrammetry Suite (LPS). DEM is generated in LPS. The UCL model is a rigorous model based on the modified collinearity equations where the satellite motion during the acquisition time is simulated. On the other hand the RPCs model is provided with the images. In a few words the RPCs model should be refined using a least four GCPs in order to reach to an accepted accuracy close to pixel. The accuracy is not improved if more GCPs are involved in the solution. The UCL model as it is described in this paper is capable to reach better accuracy than RPCs model (two-three times). In DEM generation the accuracy is within the specification of the map products. 1. INTRODUCTION In the area of remote sensing, India launched its first generation satellites IRS-1A and 1B in 1988 and 1991 equipped with multi-spectral instruments having a pixel size of 72.5 and 36m, respectively. The second generation, IRS1C and 1D, which were launched in 1995 and 1997 respectively, have a panchromatic camera of 5.8m pixel size, along with multispectral and wide field sensors. It should be mentioned that until 1999 when IKONOS was launched, IRS1C/D was equipped with the best pixel size of any civilian satellite sensors. The third generation of remote sensing satellites from India is represented by CARTOSAT-1. This satellite has on board a two panchromatic cameras pointing to the earth with different angle of view. The first one is looking at +26 deg. of nadir while the second one with –5 deg. of nadir. In this paper, the rigorous sensor model developed in UCL and the RPCs model included on the Leica Photogrammetry Suite are used to evaluate Cartosat images. A comparison of the results of these models is introduced. Additionally, the accuracy of the DEM generated using LPS is described in paragraph 5. acquisition of the stereo images is about 52 seconds. The spacecraft body is steerable to compensate the earth rotation effect and to force both Fore and Aft cameras to look at the same ground strip when operated in stereo mode. Simultaneous stereo pair acquisitions are of great advantage since the radiometric parameters of the images will be identical. The stereo pairs have a swath of 26 km and a fixed B/H ratio of 0.62. Apart from the stereo mode, the satellite is also equipped to operate in the wide swath mode. When operated in this mode the satellite can be manoeuvred such that image strips will fall side by side so that wider swath images of 55 km are obtained by the cameras. The spacecraft also has a facility to provide various pitch-biases to vary the look angle conditions of the stereo pair. The cameras specifications are introduced in table 1. Focal length (both cameras) 1945 mm Integration time 0,336 ms Quantisation 10 bits (1024) Pixel size 7x7 μm GIFOV Fore 2.452m (across-track GIFOV Aft 2.187(across-track) Table 1. Cartosat-1 camera specifications 2. CARTOSAT-1 2.3 Metadata file 2.1 Cartosat-1 Mission Cartosat-1 was launched by Indian Space Research Organisation (ISRO) on 5 May 2005. The above mentioned cameras of the satellite sensors can either acquire along-track stereo images of 27.5 km swath with a base to height ratio of 0.6 or mono images with a combined swath of 55 km. The satellite is primarily meant for topographic mapping and terrain modelling applications. The nominal life of the mission is planned to be five years. The orbital altitude is 618 km and the revisit period is 5 days. The satellite covers the entire globe in 1867 orbits within 126 days. 2.2 Pan camera The pixel size of the images is 2.5m on the ground with 1024 grey levels (10 bits). The time difference between the The metadata file of CARTOSAT which is attached with each image is in text format and provides basic information of the imagery. In this file navigation data of the satellite is not given. Fortunately, the acquisition time interval between the along track images is measured and included in this file, which should be known in order to implement the UCL along track model. 3. REFERENCE DATA The authors take part in the C-SAP as principal investigators with Test Site 3, which is the UCL test site in Aix-enProvence, France. Also, are appointed as co-investigators on TS-9 in Warsaw, Poland. Unfortunately, in Aix-en-Provence test site additional GCPs should be measured in order to have a appropriate number of CCPs within Cartosat images covered area. This procedure will be finished in the near future. On the other hand Mr. Zych (Goesystems Polska) who is Principal Investigator of TS-9 provides the study team with DEMs and with 36 GCPs which are measured in the field. These GCPs are well distributed on the images. All of them are found and measured on the images. The area covered and the GCPs are shown on Figure 1. Figure 1. Warsaw test site and GCPs distribution As it is shown on the images the ground is covered by snow which is helpful during the GCPs measurement. 4. SENSOR MODEL EVALUATION 4.1. UCL along track model description 4.1.1 Introduction. The pushbroom model is a kinematic model. The scanning effect on the ground is due to the motion of the satellite. A single image consists of a number of framelets which are independent one-dimensional images with their own exterior orientation parameters. Thus, in a rigorous sensor model the satellite motion in space should be described as accurately as possible. The well-known collinearity equations need modification before they are applied to pushbroom images. Thus, the collinearity equations are modified in a way where the ground coordinates and the rotations of the perspective center are modelled as a function of time. ⎡ X − X c (t )⎤ ⎡ 0 ⎤ ⎢ y − y ⎥ = λM (t ) ⎢ Y − Y (t ) ⎥ 0⎥ c ⎢ ⎥ ⎢ ⎢⎣ Z − Z c (t ) ⎥⎦ ⎢⎣ − c ⎥⎦ where c is the principal distance t is the acquisition time of a framelet which is defined in terms of image coordinates X, Y, Z are the ground coordinates of a point Xc(t), Yc(t), Zc(t) are the ground coordinates of the framelet perspective center as a function of time λ is a scale factor which varies from point to point M(t) is a 3x3 rotation matrix which brings the ground coordinate system parallel to the framelet coordinate system as a function of time. y is the y-framelet coordinates of the corresponding point yo is a small offset from the perspective center origin. 4.1.2. Kepler model for along track sequence. This model has already been introduced in detail (Michalis and Dowman, 2005), along with the assumption that should be met in order to be implemented. It is based on the Kepler problem (Bate et al, 1971). In the simplest case of two along track stereo images with constant rotation angles, the number of unknown parameters is twelve in total. The state vector of the base framelet of the first image represents six of these unknown parameters, while the corresponding state vector of the second image is calculated from the previous one by the Kepler equation, thus is not an unknown in the solution. The other six unknown parameters are the rotation angles of the two images; three rotations for each image as it is assumed that the rotations remain constant during the acquisition of each image. If it is assumed that the rotation angles during the acquisition time are not constant the number of unknown parameters is increased respectively. If these images are treated individually the number of unknown parameters are nine for each one, which means eighteen unknown parameters in total, thus the number of unknown parameters is reduced by six. If it is assumed that the rotation angles during the acquisition time are not constant the number of unknown parameters is increased respectively. The formulation of the Kepler model of two images case is described in detail by the following equations. The ground coordinates of the base framelet perspective center Xc(t), Yc(t), Zc(t) of both images as a function of time is defined as follows: X c (t ) = X o + u x ⋅ τ - GM ⋅ X o ⋅ τ 2 2 ⋅ ( X o2 + Yo2 + Z o2 ) Yc (t ) = Yo + u y ⋅ τ - GM ⋅ Yo ⋅ τ 2 2 ⋅ ( X o2 + Yo2 + Z o2 ) Z c (t ) = Z o + u z ⋅ τ - GM ⋅ Z o ⋅ τ 2 2 ⋅ ( X o2 + Yo2 + Z o2 ) where for the first image τ=t τ = t + dt for the second image and t is the acquisition time a framelet which is defined in terms of each image coordinates (McGlone, 2004) dt is the time interval between the acquisition of the base framelet of each image. (Xo,Yo,Zo) is the position vector of the perspective center of the base framelet of the first image (ux,uy,uz) is the velocity vector of the perspective center of the base framelet of the first image GM is the Earth gravitational parameter with value of 398600,4415km 3 / s 2 In the Kepler model, both along track images are treated as one iconic image where its coordinates are found if the acquisition time interval of the corresponding image from the first image is added (in general case of more than two images) on the framelet coordinates of each image. In other words, in Kepler model the transition factor from the first image to the second one is its acquisition time interval. 4.2. RPCs model description The Cartosat-1 data are distributed with the rational polynomials coefficients. In LPS, there is a module where Cartosat RPCs could be imported and used in the orientation of the images. 4.3 Evaluation 4.3.1 Introduction. As it shown in figure 1 the GCPs are well distributed on the images. For this reason it was decided to examine the importance of the number of the GCPS, along with their location on the images. Starting with the RPC model, which could be solved without GCPs, the scenarios which are shown in table 2 are made. In column 1 it is shown the number of GCPs while in column 2 the number of the Independent check points (ICPs). In column 3 the distribution of the GCPs are shown while in the last three columns the RMSE of ICPs are shown. 4.3.2 RPCs model solution. In table 2 the accuracy of the ICPs are introduced based on the number and the location of the GCPs when the RPCs are used for the orientation. RMSE of ICPs GCPs Distrib ICPs ution 0 1 36 35 2 34 2 34 2 34 3 33 3 33 3 33 3 33 3 33 4 5 6 7 32 31 30 29 8 28 9 27 36 - ∗ ∗ ∗ ∗ ∗ ∗ ∗ ∗ ∗ ∗ ∗ ∗ ∗ ∗ ∗ ∗ ∗ ∗ ∗ ∗ ∗ ∗ ∗ ∗ ∗ ∗ ∗ ∗ ∗ ∗ ∗ ∗ ∗ ∗ ∗ ∗ ∗ ∗ ∗ ∗ ∗ ∗ ∗ ∗ ∗ ∗ ∗ ∗ ∗ ∗ ∗ ∗ ∗ ∗ ∗ ∗ ∗ ∗ ∗ ∗ x(m) y(m) h(m) 11.79 17.54 113.81 3.38 760.23 5.37 16.01 2.33 5.12 15.84 2.42 4.89 15.93 2.43 5.12 2.32 1.49 2.29 1.97 1.49 2.29 2.51 1.54 2.02 1.89 1.84 2.03 2.27 1.51 2.09 1.45 1.51 1.93 1.48 1.48 1.50 1.52 1.69 1.65 1.96 2.04 2.02 1.43 1.57 2.06 1.35 1.54 2.10 1.34 1.38 1.91 Table 2. RMSE of ICPs using RPCs model The following conclusions could be extracted: • The accuracy of the RPCs model where no GCPs are used for refinement is not very good, especially in heights where the RMSE is close to 800m. • With one GCP the accuracy is improved close to 20m. • With two and three GCPs the accuracy is improved slightly. The location of the GCPs does not play an important role. • Four GCPs are enough in order to reach accuracy close to one pixel. • From 4 to 39 GCPs the RMSE is almost the same. As a conclusion, with the RPC model pixel accuracy could be reached using four GCPs. For this model the location of the GCPs is not important factor. 4.3.3. UCL model solution. UCL sensor model could be solved directly using navigation data, without ground control points (Michalis and Dowman, 2004,2005). Unfortunately, because in case of Cartosat no navigation data is provided the exterior orientation parameters should be calculated using GCPs. As it described in paragraph 4.1.1 where the rotation angles are constant, three GCPs are needed. However, in this paper additional tests are made, where the order of the rotation polynomials is changed from constant values to first order. The scenarios are the following: • all the rotations are constant (table 3) • first order phi rotation and the others are constant (table 4). • constant kappa rotation and the others are of first order (table 5). • all rotations are of first order (table 6). From table 3, it is obvious that using the UCL model better accuracy of RPCs model could be reached, which getting better if the number of GCPs is increasing (it is almost the same only in case of four GCPs). RMSE of ICPs GCPs ICPs 4 32 5 31 6 30 9 27 Distrib ution ∗ ∗ ∗ ∗ ∗ ∗ ∗ ∗ ∗ ∗ ∗ ∗ ∗ ∗ ∗ ∗ ∗ ∗ ∗ ∗ ∗ ∗ ∗ ∗ x(m) y(m) h(m) 1.41 1.44 1.93 1.43 1.44 1.76 1.43 1.45 1.80 1.28 1.05 1.77 Table 3. RMSE of ICPs using UCL along track Kepler model with constant rotations However, from table 4 where phi rotation is of the first order and the others are constant the following conclusions could be extracted: • The RMS of the ICPs is improved dramatically in subpixel accuracy in cases where 5 or 9 GCPs are used. • The RMS of the x-coordinate of the ICPs is reduced dramatically in cases where 4 or 6 GCPs are used and is close to 6 m. • The important factor here it seems that it is the distribution of the GCPs. In case of five or nine points there is at least one GCP close to the center of the image along the track. RMSE of ICPs GCPs ICPs 4 32 5 31 6 30 9 27 Distrib ution ∗ ∗ ∗ ∗ ∗ ∗ ∗ ∗ ∗ ∗ ∗ ∗ ∗ ∗ ∗ ∗ ∗ ∗ ∗ ∗ ∗ ∗ ∗ ∗ x(m) y(m) h(m) 6.07 1.84 1.51 0.98 1.32 1.41 6.36 1.69 1.28 0.89 1.04 1.11 Table 4. RMSE of ICPs using UCL along track Kepler model with first order phi rotation and the others are constant On the other hand, from table 5 where phi and omega rotations are of the first order and kappa is constant the RMS of the ICPs is improved dramatically in subpixel accuracy, in all cases where the distribution of the GCPs on the images is not important. RMSE of ICPs GCPs 4 ICPs - 5 31 6 30 9 27 Distrib ution ∗ ∗ ∗ ∗ ∗ ∗ ∗ ∗ ∗ ∗ ∗ ∗ ∗ ∗ ∗ ∗ ∗ ∗ ∗ ∗ ∗ ∗ ∗ ∗ x(m) y(m) h(m) - - - 0.88 1.31 1.22 0.87 1.26 1.30 0.85 1.02 0.76 Table 5. RMSE of ICPs using UCL along track Kepler model with first order phi and omega rotations (kappa is constant) Finally, from table 6 where all rotations are of the first order and kappa is constant the RMS of the ICPs is improved dramatically in subpixel accuracy, in all cases where the distribution of the images is not important. The accuracy is improved at least three time than the accuracy of RPCs and Kepler model (with constant rotations). The drawback is that for that case mainly 5 GCPs are needed for the solution. RMSE of ICPs GCPs ICPs 4 - 5 31 6 30 9 27 Distrib ution ∗ ∗ ∗ ∗ ∗ ∗ ∗ ∗ ∗ ∗ ∗ ∗ ∗ ∗ ∗ ∗ ∗ ∗ ∗ ∗ ∗ ∗ ∗ ∗ x(m) y(m) h(m) - - - 0.36 0.93 0.65 0.41 0.91 0.65 0.58 0.79 0.66 Table 6. RMSE of ICPs using UCL along track Kepler model with first order rotations. To summarize the above results, along with table 7 which is concentrated in case of 5 points solution, the following conclusions could be extracted: • RPCs model reaches close to pixel accuracy when at least 4 GCPs are used. • In this model, the distribution of the GCPs is not important. • The UCL model when the rotations are constant gives slightly better accuracy than RPCs model. • The UCL model where the phi rotation is of first order the accuracy is improved only in cases where there is at least one GCP in the center of image along the track. It should be mentioned that phi represents an along track motion and perhaps more attention should be made in this situation. • Finally, in the final two cases the accuracy is improved two or even three time where the location of the GCPs is not important. Method RPCs ω0,φ0,κ0 ω0,φ1,κ0 ω1,φ1,κ0 ω1,φ1,κ1 RMSE of ICPs -5GCPs x(m) y(m) h(m) 1.48 1.52 1.96 1.43 1.44 1.76 0.98 1.32 1.41 0.88 1.31 1.22 0.36 0.93 0.65 Table 7. RMSE of ICPs using RPCs and UCL along track Kepler model with various rotations order and 5 GCPs 5. DEM using LPS 5.1. Introduction. This section reports on the generation of a DEM using the the Leica Photogrammetry Suite (LPS) version 9. The DEM generation has a pixel size of 10m and is based on area-based matching which is also called signal based matching. The LPS is used because the UCL sensor model has yet to be linked to stereo matching software. In the LPS all the strategy parameters can be changed adaptively, which may improve the results of the strategy application. Adaptive changes take place between iterative pyramid layer processing. In order to check the accuracy of the produced DEM the following sources are used: • The Ground Control Points • The DEM provided from the PI (15m pixel size) The area covered in a hilly area where the difference in heights within the whole area is 120m. Suite software. The results that are introduced within the paper leads us to the following conclusions: 5.2. DEM quality. For the CARTOSAT data the default strategy of the software is used as it is produced quite good results. This strategy is the following: • Search Size: 21 x 3 • Correlation Size: 7 x 7 • Coefficient Limit: 0.80 • Topographic Type: Rolling Hills • Object Type: Open area • DTM Filtering: Low On sensor modelling issue: • RPCs model reaches close to pixel accuracy when at least 4 GCPs are used. The distribution of the GCPs is not important. • The UCL model when the rotations are constant gives better accuracy than RPCs model. • The UCL model where the phi rotation is of first order the accuracy is improved only in cases where there is at least one GCP in the center of image along the track. It should be mentioned that phi represents an along track motion and perhaps more attention should be made in this situation. • Finally, in the final two cases where the kappa rotation is the only constant rotation or when all three rotation are of first order the accuracy is improved two or even three time and the location of the GCPs is not important. The search size and correlation size was not allowed to change adaptively. The general mass point quality is described which is covered the whole area of the Cartosat images images. 83% of the points were of excellent or good quality, 17 % were suspicious. 5.3. DEM accuracy. The accuracy of the DEM is described in table 8. The accuracy is compared to the reference DEM and GCPs as it has already been mentioned. MAX (m) RMSE (m) -5226.79 195.54 20.18 Absolute linear error LE90 (m) 4.02 -178.31 194.75 6.65 3.88 9 -176.27 194.97 6.62 4.14 36 -160.83 194.36 6.57 3.93 No of GCPs MIN (m) 4 6 Table 8. Accuracy of DEM with different number of GCPs used in the orientation From table 8 it seems that at least 6 GCPs should be used in order to find RMSE value close to 6m. On the other hand if the critical value is the Absolute linear error LE90, almost identical LE90 is reached using from 4 to 36 GCPs. As a general conclusion, in the DEM generation from Cartosat data when RPCs model is used 4 GCPs should be measured in order to reach the accuracy as it is described in table 8 which is not improved, in reality, if the number of GCPs is increased. 6. CONCLUSIONS AND FURTHER WORK This paper has described the testing of the UCL Kepler Along Track Sensor model and the RPCs model on Cartosat data. Also a DEM is generated using Leica Photogrammetry On DEM generation issue it shown again as in case of SPOT5-HRS that the use of the along track stereo sensors is a very promising for DEM generation, as the image matching quality and the achieved accuracy is very high. In the future the following points should be examined: • To examine in more detail the order of the rotation angles and the effect on the stability of the solution. • To link the UCL sensor model to stereo matching software. 7. REFERENCES Bate R., Mueller D.,White J., 1971. Fundamentals of Astrodynamics, Dover. Leica 2003. “Leica Photogrammetry Suite:User Guide”. McGlone J.C., 2004. Manual of Photogrammetry, ASPRS. Michalis P., Dowman I.J., 2004. A rigorous model and DEM generation for SPOT5-HRS. The International Archives of the Photogrammetry, Remote Sensing and Spatial Information Sciences, Vol. XXXV, Part B1, Commission I. pp 410-415. Michalis P., 2005. Generic rigorous model for along track stereo satellite sensors. PhD thesis submitted to University of London. Michalis P., Dowman I.J., 2005. A model for along track stereo sensors using rigorous orbit mechanics. International Archives of the Photogrammetry, Remote Sensing and Spatial Information Sciences, Vol 36:1/W1 Proceedings on CDROM.
