IE UPTAKE OF CADMIUM AND ... MOLLUSCS AND SHRIMP EXPOSED TO ... CONCENTRATIONS
advertisement
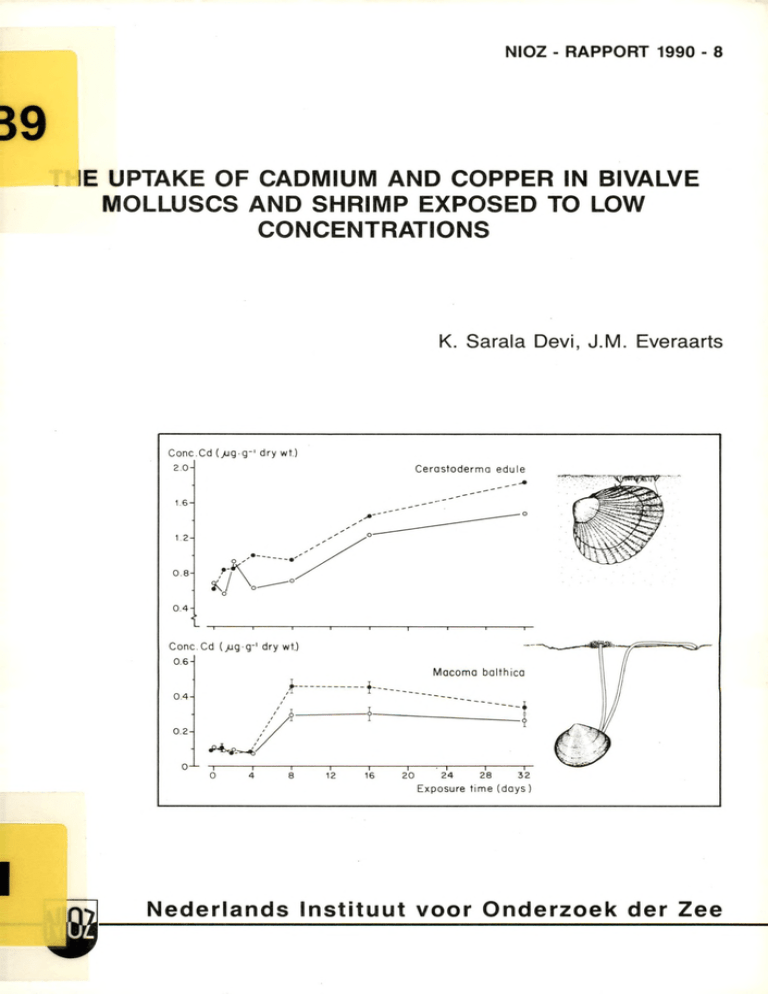
N IO Z - R A P P O R T 1990 - 8 IE UPTAKE OF CADMIUM AND COPPER IN BIVALVE MOLLUSCS AND SHRIMP EXPOSED TO LOW CONCENTRATIONS K. Sarala Devi, J.M . Everaarts Nederlands Instituut voor O nderzoek der Zee © 1990 This report is not to be cited without the consent of: Netherlands Institute for Sea Research (NIOZ) P.O. Box 59, 1790 AB Den Burg, Texel, The Netherlands ISSN 0923 - 3210 THE UPTAKE OF CADMIUM AND COPPER IN BIVALVE MOLLUSCS AND SHRIMP EXPOSED TO LOW CONCENTRATIONS K. Sarala Devi*, J.M. Everaarts NETHERLANDS INSTITUTE FOR SEA RESEARCH 'Present address: National Institute of Oceanography, Regional Centre, Cochin-682 018, Kerala, India NIOZ-RAPPORT 1990 - 8 SUMMARY The uptake of concentrations mussel), and in Cerastoderma edule under Each basis, groups of showed in specimens from the seawater accumulated until cadmium f ir s t day*1. (cockle), In Macoma balthica Cranaon cranaon a significant of low ambient edulis (baltic (brown as well as different edulis after an i n i t i a l uptake process, and ü. (blue te llin ) shrimp) was level. until In period juvenile the specimens of £. with an uptake-rate of 0.087 in i t i a l exposure end of cranaon. pg by on a dry concentration with an uptake-rate followed between control of levels. about exposure, taken 4 days, specimens of and weight balthica. cadmium was lag linearly period, difference concentrations of equilibrium adult levels Mvtilus conditions. was taken up linearly order different species whole-body tissue both metals adult at mollusc species experimental species exposed up the bivalve the crustacean studied In cadmium and copper in of £. and edule indicating 0.035 pg a C d .g '1. the cadmium uptake was C d .g '1.d a y'1 an equilibrium during the concentration le v e l. Copper accumulated linearly with an uptake-rate concentration £. of cranaon varied relatively this of high high The for soft pg Cu.g * 1.d a y '1, at tissues considerably containing level of present dry wt. mainly due to blood pigment haemocyanin, e d ulis. copper concentration fluctuated 60 p g . g '1 naturally, M. a mean ambient during exposure and concentration of in around a Compared to the presence these fluctuation significant. concentration was twice both 0.14 whole-body 1.8 pg.dm'3. The whole-body copper copper content the copper are not of in as cadmium cases concentration high as and the nominally dosed even lower tissue lim it in the experiments the background concentration than acceptable of for metals (0.2 pg.dm'3) open ocean waters the background level concentration considered in for were copper. below human consumption. In the 1. INTRODUCTION In seawater, trace metals complex-bound to organic chelated with particulate of a colloids, material metal may uptake by aquatic accumulate diffusion particulates predominant suggest waterphase, (Engel s i The control of widely of (1975) shrimps Most high The use of for test of metal pollution included Council for studies studies levels concentrations) (only for their J.P. Boon and P.A.W.J. and to also water quality and suggestion have been for frequently Monitoring uptake applied Both, as mussels Programme of (ICES). in generally the the field. On the to marine organisms, trace metals the basis Eisle r to cadmium than Bak for checking Director, National Institute She to carry during levels. copper at low e dulis. to The present than naturally Mvtilus the English. of this and to Fischer, L. the analytical c r it ic a l reading NIO, of The f i r s t Industrial Oceanography, Centre of grateful out and higher molluscs Scientific Regional is cadmium de Wilde for of Scientist-in-Charge, have been confined concentration are due to C.V. Council Research. with support thank the fellowship are the tools ambient occurring Cerastoderma and the brown shrimp Crangon crangon. Acknowledgement.- Thanks study-leave. from useful coastal were more sensitive slig h tly by the bivalve SdillS and Macoma balthica B. the water Crustaceans the Sea on cadmium toxicity with the uptake of Nolting in bioassays the Joint crustaceans in metals tissues Watch. in of to from the and teleosts. concentration R.F. in Exploration and evidence activity following the laboratory, and they are compared to the natural study deals mussels for and food which are the is made them soft Mussel animals of species accumulate attention the Global absorption there ion of may 1983). has and their considerable toxicological doses to their tissues research concluded that both molluscs a l., form organisms uptake mainly occurs the metal molluscs as are extensive (1971) to inorganic and the rate by metal form, acids, chemical ingestion Cd and Zn, many indicators International soluble Sanders s i and Aquatic water by ionic huraic The exact a v a ila b ility and 1985; such work. in For in with organic toxicity. example Cu, in received employed biological and of for its the surrounding proportional environmental experiments it s to 1972). many marine organisms water Goldberg also 1977). for 1981, a b ilit y has but from of and is preferred adsorbed the body surfaces, in ai-, or dissolved associated only determine (Ph illip s, surrounding marine not biota forms that occur (Stumm & B ilin sk i, metals across can substances, author Dona Paula, Cochin for the Netherlands and to the manuscript wishes Research, UNESCO and NUFFIC for work at Gerringa procedures, Goa and the granting the to India; her award of Institute for a Sea 2. MATERIAL AND METHODS Adult specimens of the blue mussel shrimp Cranqon cranaon were collected respectively, part of from cockle in the measured were for use and were filtered experiments 4 days starvation werecarried out in water was in by For the system. and that content were and copper cm3.min-1 water of cadmium and copper (Table and 1) M. dilution of cranaon balthica and on consecutive Pooled freeze-dried About 0.1 m g, 1972). n itric 2 of 1% of shrimps The range animals acclimatization (cf. Tables) nor flow-through temperature of - 12 contamination teflon glass 15°C. h light of the materials. The of 30 aquaria °/oo anc^ (60/30/30 from solution standard the was of (Table days after in seawater the and of drawn system was cm3.rain-1, so exchanged at that least the dose was 40 the once in 0.2 pg.dm'3, standard stock solution The exposure time was 24 or 32 days. 4), in (10 specimens 20 specimens were taken before dosing weights stock with seawater 0.21 (concentration 3)) wet m g of were These the 1-4). 12 h dark by dilution tanks 191). (Table as were of £. indicated in of edulis edule starting determined homogenized dried the the and the of organic (Table 2) experiment tables and samples were were carried extraction ammonium of water metals to out bombs were kept 10 cm3 in for samples, (DDDC) isobutyl-ketone phase and (Paus, suprapur at 65% 120 °C for polypropylene tubes. each sample. 500 cm3 of pyrrolidine-dithiocarbonate After technique 3 cm3 of acidified in water were complexed with ammonium diethyl-dithiocarbonate (MIBK). weighed to the nearest material teflon samples were diluted The dissolved sample, destruction-bomb added and the Duplicate destructions For the weight control ( 1 dm ) and animals For the decomposition were used. intertidal one tank was used as solution was decomposed by an acid hours. the to constant weight. 400 acid of continuous Metal concentration factor the water and Q . figures. sulphate the experimental both Samples prepared the metal The theoretical for a Rectangular The flow rate of 24 hours. 50 pg.dm~3, of exposition. doses cadmium chloride from m , the baltic the the experiment had a s a lin ity each experiment used. metal of and/or loss applying cm) tank for size a constant submerged. avoided seawater used weight regime of saturated. The from fed during weight a climated room at continuously were 3 were observed. was completely oxygen the other specimens (Tables and were not significant experienced a night-day circulating 1 and the westernmost specimens by digging within a narrow the no system in The animals in for The experiments seawater and the brown of in (1-year) and adult the bivalves and the animals acclimatized of the Balgzand Juvenile were collected of and and exposure period; indications of edule edulis same area. Length and weight were selected Sea. Cerastoderma Macoma balthica mud-flats were channels the Dutch Wadden edible t e llin the Mvtilus with beam trawls (APDC) extracted separation and water a mixture 1% diethyl- into the complexes methylin the MIBK were destroyed metals were 10 cm teflon 1974). flow tubes Extractions bench fitted contamination (Merck). rinsed by adding back-extracted of for the Most materials with further were done in concentrated into a in suprapur double-distilled measurement teflon a ll used were teflon 6N HC1 and three (Kinrade made or used coupled teflon 5000). Elmer, out: duplicate model single each analysis The following experiment/ destruction pooled dry weight)/ 403). (except single each decomposition duplicate and Elmer, (HGA model spectrometer procedure was pooled individuals/ edule because of low amount of single AAS-measurement. avoid suprapur atomizer (Perkin replication sample of for £. a laminar To water. Copper was measured with a flame atomic absorption (Perkin carried spectrometer in in Loon, coated, times with double-distilled to an atomic absorption The van were Cadmium was measured with a heated graphite-furnace 500) & container. chemicals acid. and stored separating-funnels clean-laboratory samples, n it ric water analysis of Cd and Cu/ 3. RESULTS 3.1. Cadmium uptake experiments: The cadmium concentration f il t e r during of feeder edulis the f i r s t cadmium 4 days of in of soft between 0.5 exposure to a concentration day and thereafter the whole-body varied (Fig. 1a). tissues and 0.6 of the pg.g“1 dry wt, An obvious accumulation 0.75 p g . g '1 was observed on the 8th a plateau was reached. Cone. Cd (/Jg g-1dry wt.) 1.0 - Mytilus edulis 0.8 0 .4 - 0 .2 - 1----------1 ----------1 ----------1 - Conc. Cd (jug dm-3) Figure 1. The total The uptake of (pg.g-1 dry weight; waterphase a dose concentrations of respectively. the common mussel given of 0.2 pg.dm-3 and 0.88 15 °C, concentration the with a mean in values) with a control (•----------• ); pg.dm'3 Mvtilus in £ whole body soft Exposure time 32 days, were measured at 0.59 is mean and duplicate (pg.dm-3). nominal experiment cadmium in cadmium concentration and £ the (o— o) actual value the control edulis. tissues and cadmium during the and exposed, After an experiment, slig h t ly (F ig . The was in i t i a l mean 0.59 aquarium. the the control comparison concentration the fir s t water four days progressively of the decreased 1b). A in (ÛCCd whole-body during in cadmium concentration pg.dm'3 in animals increase the cadmium levels soft cf. the water - 0.88 the soft CCd(exposed) tissues D.W.(control ) ; between whole-body = in and difference tissues 1) evidence for a relationship between the concentration at (Fig. of of 2a). exposed in the cadmium and 1a) no control and their D.W.( exposed) exposure Also cadmium in = experiment the Fig. (ÛD.W. a certain the in exposed Ccd(control ) ; cf. pooled dry weight Table during pg.dm'3 time showed no correlation whole-body soft exists tissues and the mean wet weight. - r 0.1 0.1 0.2 0.3 04 0.5 - - I _____ I_____ I_____ I_____ L_ 0.1 0.1 _1_ _l_____ I_____ I_____ I_____ L 0.2 0.3 0 .4 0.5 i 2- - 0.2 1- - 0.1 0- -0 1- - Mytilus edulis - Cerastoderma edule 2- AD.W. 0 .2 H -1 - 0. 2- - 0 .4 - 2. whole-body in Macoma 0.2 -2 -0 — 1 Crangon crangon M a co ma balthica AC r —I--------------------1-----0.1 (a), - - 0 .4 - L (ÛD.W. 0.1 A D.W. 0- Figure - - The 0 .2 0.3 0.4 0.5 = D.W.(exposed ) juvenile balthica - relationship (ACCd = CCd(exposed) cockle (c) where o and • refer to 0.1 0.1 between - D.W.(control )) in adult 2 0.3 0.4 0.5 the cadmium concentration in Cerastoderma edule and 0.2 Ccd(control )) two different — J —r~ 1--------1--------—1-----------------r~ 1------1--------- 1--------- r adult (b), and body mussel in dry in weight Mvtilus edulis baltic t e llin adult brown shrimp Cranaon crangon (d), experiments 10). (cf.: p. 9; Fig. The results M- balthica linearly, an on the uptake of are according uptake rate + 0.035 given * X; of r cadmium by the bivalves Fig. to a normal 0.035 N = 7; in 3. In £. f ir s t order p < 0.001), edule accumulation pattern, pg Cd.g ' 1.d ay'1 (linear = 0.968; £. and edule. cadmium was taken up in regression: the exposed with Y = 0.771 specimens. Cone.Cd (jug-g-1dry wt.) Cone.Cd (jug g-1 dry wt.) Exposure time (days) Figure edule 3. (à) The concentration weight; uptake of and the baltic is given cadmium in te llin mean and duplicate concentration Exposure time 32 days, dose of pg.dm'3 (•— •) 0.2 0.51 15 °C, pg.dm'3 in edible the the control values) with a control actual with a mean value cadmium during and exposed, cockle Cerastoderma (fe). The total in â and b whole body soft (pg.dm'3). measured at the Macoma balthica cadmium tissues (p g .g '1 dry and £ the waterphase (o— o) and a nominal concentrations the experiment respectively. of 0.45 were and However, it occurs, was also though to C d .g '1.d a y'1 0.905; p < seen that a lesser (linear 0.001). in untreated animals extent, with an uptake regression: = 0.649 a lag-time concentration in £1. balthica increased dry wt. exposure Within concentration After Y than M. time £. The aquarium varied exposed animals concentrations; 0.45 pg.dm-3 When that of an increase of - decrease in balthica. in £. the In one cranaon with an 0.077 + 0.087 fir s t order relatively The data difference the water 4d), did (0.07 of not both show weight (cf. 3.2. In second (Fig (Fig 4, Mvtilus 5a). The slig h t ly with soft 2c). cadmium the water was exposed. it in a in body can be concluded whole-body significant dry (p soft < 0.01) weight). relationship the f i r s t p < 0.05), pattern (Fig. level in exposure In M- between these whole-body of £. days of 4a).This towards the (0.86 end of experiment, with cadmium pg.dm'3 (Fig. 4b). a very slight pg.dm'3) whole-body in (Fig. cadmium animals. correlation existed between whole-body = D.W.( exposed ) - Moreover, by a concentration (0.46 in Y = normal exposure. 0.17 pg.dm'3) expressed as ÛCCd = CCd(exposed) 2d). a was followed the water differed chance exposure, regression: indicating pg.dm'3) and exposed no in four pg Cd.g"1.d a y'1 (linear significant neither concentration showed - CCd(control) D.W.(control ) on the concentration any relation to in the the body 4). experiments: the exposure, copper the (Fig. difference 2b), tissues a exposed and control Fig. edulis during higher higher the the (Fig. ) between the mean tissue Table pg.g"1 a exposed and cadmium in = 0.958; (0.39 any in Copper uptake linearly only the with such expressed as ÛD.W. weight basis nor r experiments, and body weight, dry during 0.087 pg.dm" both of pg.dm'3) and exposed cadmium concentration, water no concentration control concentration, In of (0.69 the 0.45 experiment concentration cadmium concentration of = cadmium 2c). N = 4; constant the pg r augmented cadmium concentration correlated accumulation mean the the cadmium concentration linearly X; between control The (Fig. uptake rate * N = 7; about both the pg.dm'3 in (whole-body experiment, increased of slig h tly animals cadmium was contrary, parameters was found only relatively the edule of during Ccd(control )) body weight on the water and 0.51 the exposed and control tissues X; days, to values concentration the control (ACCd = CCd(exposed) in considerably mean correlating weight four * 0.027 edule accumulated cadmium to experienced the in + 0.027 also of balthica. The cadmium concentration control of accumulation rate tissue concentration with an uptake rate concentration in and showed a mean value maximum and minimum values of 6.7 of of thecontrol 6.4 and 6.0, of 0.14 copper pg specimens p g.g"1 (S.D. respectively. increased Cu.g " 1.day*1 varied ± 0.3), with Conc. Cd (jug g-' dry wt ) Conc.Cd (jug-g-1dry wt.) 0 .8 - Crangon crangon 0 6 ' O-L 1-1 -1 ----------1 ---------r~ 1 ------------- 1------------- 1-------------- 1-------------- 1------------- 1--------------r ~ I I 20 24 Conc.Cd (jug d m -3) Conc.Cd !jug dm-3) 1. 2 - Sea water 1. 0 - 1------------- 1------------- 1------------- r - 12 16 20 24 12 Figure 4. The total dry The uptake of weight; waterphase a dose concentrations (d) Exposure of 0.2 of (fc) 0.39 of the brown shrimp Cranaon cranaon. given in â and £ whole body concentration time 24 days, pg.dm'3 were measured at experiment experiment is mean and duplicate (pg.dm'3). nominal f ir s t cadmium in cadmium concentration values) the with a mean and 0.86 and 0.46 pg.dm'3 in the (o— o) actual value pg.dm'3 (p g .g '1 and b and £ the with a control (•---------•); 15 °C, 0.69 16 Exposure time (days) Exposure time (days) during and control the and and cadmium the second exposed, respectively. The copper trend day towards (Fig. pg.dm*3) the 5b). in experiment concentration the in Concentrations exposed than of water showed 8th day and remained almost 1.79 in were only control and 1.50 a slig h tly aquaria, slig h t ly constant higher decreasing t ill the 32nd (about 0.3 with mean values pg.dm'3, respectively. during Cone. Cu (>ugg_ldry wt.) Exposure time (days) Figure 5. The uptake of The total (pg.g-1 copper dry weight; (pg.dm"3). a dose of were measured at 1.50 Exposure 0.2 15 °C, an i n i t i a l copper followed cranaon by linear a in control specimens, the common mussel the course at of concentration time 32 days, the control day' increase during and exposed, (Fig. the 6a). the copper concentration only slig h t ly lower the tissues and the (o— o) and concentrations experiment of respectively. the whole-body concentration during again values) copper e d u lis. soft with a control the actual increase, decreased Mvtilus in a whole body with a mean value 'f i r s t in £. pattern in given pg.dm"3 (•— •) and 1.79 pg.dm'3 in After of is mean and duplicate waterphase nominal copper concentration ambient subsequent 7 Remarkably, the same in the was observed concentrations. days, The copper values levels during in the water the experiment of and exposed groups, respectively varied 0.75 (Fig. considerably, and 1.05 pg.dm'3 in with mean the control 6b). Conc.Cu (jug-g-1 dry wt.) Conc.Cu (jug-dm-®) 1------- 1-------1-------1------- 1------- 1------- 1— 0 Figure 6. The total weight; The uptake of mean and duplicate of 15 °C, body edulis copper is (Fig. (•---------•); the control was 7a) of nor the brown shrimp Cranaon cranaon. in à concentration whole values) with a control the actual during and exposed, - in £. cranaon (Fig. (p g .g '1 dry (o— o) and a nominal copper concentrations the experiment of were 0.75 and respectively. Ccd(control)) exposed and control body and J* the waterphase found between the relatively (ACcd = Ccd(exposed) weight in given with a mean value correlation concentration in - 3 pg.dm- pg.dm"3 in No 12 16 20 24 Exposure time (doys) Exposure time 32 days, 0.2 measured at 1.05 8 copper concentration (pg.dm"3). dose 4 animals 7b). augmented copper and the (ÛD.W.), difference neither in H- ADW. 2- 0 .4 1- 0 .2- 0- 0- ADW. -1- Mytilus edulis 2- L - - 0 . 2- - 0 .4 Crangon crangon - L ~l------ 1-----r -1 3 4 -T-//-T- 5 4 11 A C Cu Figure body 7. The relationship (ACCd = Ccd(exposed ) - D.W.(exposed) - in shrimp adult 4. brown Ccd(control )) Crangon in adult crangon in whole- and body dry weight mussel Mvtilus (Ad .W . edulis (a) = and (b). DISCUSSION The concentration considerably in i t i a l period of the waterphase are aquaria, such as organisms the source for in to obtain a susceptible In body low as tissues study, of fj. of be described the cadmium external concentration in wall, during circumstances physiological concentration dosed, low the pump, in in the activity exposure. Another might be especially experiments the analytical at waterphase biomass during the present the concentration edulis procedure concentrations, and in at in order for metal is very it s in the No in the whole correlation relationship average levels a significant and same average dose. concentrations, cadmium in the content interspecific between there organism is w ill no (1986). difference the which may be related evidence reflect the environment specimens Although uptake rates with between a study by Coleman and coworkers reveal concentration of showed no significant cadmium in water. those data did the changing the cadmium and copper the p e rista ltic Moreover, cadmium received of especially accumulation either metal applied of However, to to the glass the the concentration could due of in especially contamination. the present soft in copper experiments, Such fluctuations mainly dose. water, of cadmium and the flow-rate low pumping rates in the various and the decreasing the analysis to~tal in adsorption variations irre g u la ritie s of exposure. of to Cu between the copper concentration D.W.(control )) varied in AC that the environmental conditions 1976). (Bryan, proportion of the metal thereby keep their the present tissue study, the levels, mussels al-, in 1986). are are able intake contaminated conditions for able to edulis ionic lag period before accumulation occurs, complexed al- Ritz (1982) and accumulation rate concentrations, uptake that is consistent during period the animals. in in lower the edulis von accumulation exposed Like failed in in to matter of well in Westernhagen shorter and al-, si period to concentrations as Ritz exposure high higher pattern of (1977) molecular values uptake during noticed marked and exposed mussels, al-» si even periods previous studies between (Fowler was 50-200 as Also a low relation uptake 1978, of must 1977). pg.dm'3) and lowest direct cadmium cadmium observed a significant experiments, a et i n it i a l with these data; also (2.5 the present the water at (1986) demonstrate Coleman This between exposed and control concentrations the cadmium, George & Coombs increase agree al- si background shows an The low and fluctuating subsequent concentrations concentration to organic of exposed to higher ranges. of In 8 days observed previously suggestion experiments experimental also 5% of 1 9 77 ; concentration were noticed between control exposure time. 1974; uptake. Amiard-Triquet difference have and present differences of the at because (1986) higher and may levels. (George & Coombs, concentration with before possible i n it i a l at cadmium in Mlow about a after weeks possibly al- si cadmium must be complexed eg. weight, the of two cadmium also can occur Coleman even at normal (George & Coombs, exposed to uptake excrete f a ir ly eliminate weeks to accumulation During be before at further excretion. the previous M. under concentration lim it exposure may be due to accumulated Some species & 1982). recorded the Benayoun, A linear on mussels pg.dm*3 (George & Coombs, 1 977 ) . In Mvtilps from Port elevated cadmium levels ranging groups between between cadmium 8.7 10 and 90 m m (Talbot, from those data, of body size of was 0.2 agrees 12.6 concentration weight basis (cf. irrespective of of of data, Corio 1985). The with a size Bay, of a value the different mean value 50-60 m m , 0.2 pg.dm'3 in showing no 2a). Moreover, tissues lower than the of M- reported progressive increase at filtered size of the calculated the (40-50 values in of to This between both on wet- cadmium edulis exposure seawater. relationship cadmium and body weight, Fig. a from and the body concentration, levels in whole-body soft pg.dm'3 was contaminated with water with p g . g '1 at a cadmium concentration in the 3 . These data showed no relation between the the organisms with the present measured 0.29 in mussels pg.dm" ambient concentration tissue Bay, circulate and 21.6 p g . g '1 was found for concentration seawater P h illip which the and dry concentration m m ) exposed to Talbot uptake towards (1985), the end of exposure. In the gradually exposed cockle un til A and occurred edule end of specimens. between control cadmium £. the the the marked exposed according cadmium exposure difference animals to time, was a normal in concentration both in increased the control the concentration induced. firs t order and level Accumulation proces, of both at mean arabient concentrations pg.dm'3 (control). pg.dm'3 results concentration towards in in water concentration the biological available However, desorption organisms of from sediments, eight days in of in it i a l caamium in observed 1979). significant In days of balthica Ray edule, during comparison, different upon (cf. Fig. of of 12.5 present Extensive organisms small, study both on molluscs control as well to moulting incidence of the animals. concentrations during high of 24.4 and (Cooke slL very low waterphase a the of H. McLeese showed respectively. copper found. at & of cadmium However, even of 1971). the at The slig h tly to results large of 30% loss of the only (day A 3) higher the metal & Benayoun, animals. In the number observed (10 in captivity the a low incidence inluencing 1 and major and uptake of (Fowler (1977) cadmium of 1976). amount cranaon cadmium observed toxicity eliminated marine to However, stress (Ahsanullah, sign ifica ntly exposure toxicity cannibalism and a is Dethlefsen i n it i a l after size cadmium concentration clams in cadmium level between the (Eisler, the moulting concentgraions a l.. reacted ambient was observed by are animals not an was even at are more sensitive animals, bioassay p g . g '1 from cadmium. authors affect after cadmium in p g . g '1 dry wt. net-uptake, with brown shrimp £. was observed, experimental to of a phenomenon may cause up to experiments mortality exposed during of pg.dm'3 no net-uptake was and teleosts the since in relationship show many w ill during This 1.4 the 2a). increase high in occurred increase the Fig. marked decreased balthica. evidently crustaceans of experiments exposed M- cadmium moulting accumulated of as an 7.3 medium and large concentrations studies encountered by 1974). of (Cooke of uptake had not in p g . g '1 dry wt., did demonstrated that are cadmium exposure (cf. on cockle, uptake showing a cadmium equilibrium and 8.5 problems present t e llin 2b), 14 days, augmented ambient leading took place An inverse a much lower concentration than of in precipitated actual been shown that When exposed to a relatively 21.8, Thus to and ambient cadmium concentration 45 pg.dm'3 for data has such a slight exposure. (1984). levels days it the to a concentration wt. a of reduction the concentration at in levels From a study was achieved by means concentrations the baltic a lower b io -a v a ila b ility dry four study, cadmium way but respons calcium carbonate was calcium carbonate, p g . g '1 bioaccumulation concentration 8 measured, 0.55 ambient though No 0.06 in it ia l exposure. sediment. only resulting cadmium bound Unfortunately, the present augmented a of in £. In the biogenic the 0.45 cadmium The concentration which the cadmium content seawater. value to and the sediment-bound cadmium to from the waterphase. of due pattern, a v a ila b ility from of p g . g '1 in the end of considerably this the waterphase was not dry weight any edule. whereas cadmium occurred of difference concentrations animals. towards (exposed) cadmium bound to biogenic to £. calcium carbonate was 1979). show a v a ila b ility dm*3 0.3 mainly exposed not of ambient noticed was concluded that readily pg. concentration tissues, in did was 0.51 difference the uptake-rate cadmium a l .. a a slig h t ly augmented higher it Thus in of in and £. of minimum cranaon 20 pg.dm" ). However, in specimens conditions after cadmium had not exposed 30 days of increased in of with respect of 2.5 the present to a rapid of an study accumulation found. rise Also in in another An increase s lig h t ly of to a contrary, 30 days, times higher in f ir s t external sign ifica n tly during exposure an constant level. biological reaction characterized level. in Davenport, starting and continued experiment, w ill the no the f i r s t long load was steep period a l- (1986) days; of is an in of seawater shells for not show any did 8 16 and gradually as a linear only days a of higher with higher trace levels si. element in lethal show a physiological the range of were proces vary (Amiard-Triquet (Scott several in copper slig h tly the not the bioaccumulation 0.5 orders t ill the of study, reaction started augmented to & Mayor, the present valve-closing So accumulation of in pg.dm'3, hours applied even a 330- copper may be in several to at attained Mussels the be reflected 100 essential 1976). in e d ulis. exposure mussels exposure exposure. the of of to regulate period of in £1. found that after These concentrations at Thus mass than the concentrations did copper concentration (Bryan, their 1977). concentration of to organ and decreases concentrations even by study, already even low concentrations species individuals the four copper closing magnitude higher copper concentration and increasing marine Thus, Due to the low of whole-body proces. visceral in copper from organ to copper where the the Although mg.dm'3, order copper the f i r s t processes, several 1977). septemspinosa. a accumulation The a b ilit y of mussels contamination 1986). the total concentrations in increase copper varies of specimens agree with these data the present Cranaon Amiard-Triquet s i level flow showed a linear (Dethlefsen, 4a,b) concentration applied pg.dm*3 in linear concentration 1972; Fig. shrimp species, augmented copper body burdens. 10 (cf. a significant total for pg.dm*3 for in constant 1981). 0.3 induces according âl-, the characterized by an increase £ i a l-, (Ray waterphase, of On the cadmium concentration was found within exposure of under short-term accumulation early plateau ambient cadmium concentrations term pg.dm*3 the whole-body concentration whole-body cadmium concentration the results building 1.5 significantly. exposed to a concentration increase to exposure, upon immediately end of ambient the copper concentration. The copper compared to concentration the experiments. bivalve These 65 p g . g '1 dry wt, are bloodpigment An increase of in itiate copper in significant negligible Ray level and w ill ai- to uptake of in animals. concentration due exert the very in of yet it presence is p g . g '1 dry any physiological copper of the concentration in Q . does not whole-body higher the this effect. copper shrimps. concentration that account wt), present the of are consistenly into high between 50 and apperently remarkable is in varying Though the copper taking 60 cranaon involved the waterphase copper. £. the body fluid exposed animals (around (1981), the However, not species body burdens haemocyanin variations, concentrations control molluscs pg Cu.dm'3 in showed considerable whole-body high baseline containing 0.3 in In than high increase is a study of septemspinosa exposed to two sets significant changes concentration in of During the The role the condition affecting 1970; which were subjected to organisms M. of 1972). a decline stress sediments value, showed even appeared to be high the present stre ss', e dulis. metals However, in though (60 have no the pg.dm" It of is of ) animals for example excluded in Bayne & Thomson, (1986) did not cadmium in mussels not very uptake the the be al. rates influenced because not cadmium; Coleman s i stress. study, which alters may (eg. accumulation nutritive would significantly, in 'n u tritive accumulation evidence of nutrition described of Thomson & Bayne, find water and metabolism of the i n it i a l study. experiments fed. contaminated the the overlying compared to the present were not highly from of lik e ly that metals relatively short in the exposure period. The data of between of the the present whole-body both cadmium and balthica and experiment No £. copper apparently did were £. edule. a the Southern is of the of Bight 0.45 pg.dm'3; Kremling the lowest values The nominal reflect twice for only as high as species groups. importance of the are in each (Duinker of now and only open ocean in 10 copper species basis. of the of lower impact of "no environmental control than the waters 1977). Sea It (0.2 than (Bruland, 1980) experiment levels open for thus and are only ocean waters copper. and tissue indicate processes environment. in on aquatic assessment. of the the Sublethal and sensitive concentrations in exposed showed different important - higher control contaminants effect" North These results from the increasingly 2b). to less times physiological cadmium and copper evaluation whole-body showed marked differences between investigated specific becoming is present in 1-4). weight the coastal surface water the Üthe the cockle (Fig. & Nolting, augmented contaminant on a dry weight a method of in from the Central 1988) dosed and determination can be used as Sea the experiments species dry of Higher experiment copper of Tables it s body weights than the background level cadmium levels bioaccumulation studies used Moreover, concentration North & Hydes, slig h t ly and specimens the background concentrations of (cf. pg Cu.dm"3 dosed additional the values in e d u lis. the course augmented cadmium found. lower the present the as measured very was to 1.5 pg.dm'3 for cadmium and even lower A ll the 0.3 concentrations concentration for correlation during of tissues (1-year) relationship of during the body weight juvenile were related about same level affect fed a and the concentration specimens being whole-body in of seawater concentration background level of in significant concentration adult Not not However, cadmium concentrations The in dry weight found between the relatively and copper concentration 2 and 7). tissues cranaon. correlations (Fig. study gave no evidence for soft l if e tools and contaminants 5. REFERENCES Ahsanullah, M., 1976. invertebrate Mar. Freshwater Amiard-Triquet, C., Contribution and zinc Mar. Bayne, Acute toxicity species in Biol. B.L. Res. B. 92: G.W., C. 1970. 20: in Letters in 97: 1986. cadmium, copper e d u lis. I I . Experimental laboratory. - distributions of aquatic organisms. Society 2. J. study.- consequences of Helgoländer wiss. of cadmium, Earth heavy metal A.P.M. Lockwood. for zinc, and Planetery M. Press: Mobley & N. planulatus: an integrator of contamination Effects experimental Cambridge University Mann, - 176-198. Some aspects T.F. Amiard, study of the North Pacific. In: N., seven 526-552. Oceanographic organisms. series & J.C. Some physiological the aquatic Coleman, Metayer Mvtilus edulis 1980. 1976. to - Aust. 7-13. and copper Science Bryan, Victoria. 187-196. Berthet, Thompson, Meersunters. nickel 27: the mussel & R.J. K.W., cadmium and zinc to the ecotoxicological keeping Mvtilus Bruland, of from Western Port, of in pollutants biology on seminar 7-34. Hickman, 1986. Mvtilus cadmium pollution? - Mar. edulis Biol. 92: 1-5. Cooke, M., G. Nickiess, a va ila b ility of R.E. Lawn & D.J. Roberts, sediment-bound cadmium to Cerastoderma edule. - Bull. Environ. 1979. the Contam. Biological edible cockle Toxicol. 23: 381— 386. Davenport, J. 1977. continuously A study of the effects and discontinuously in of (L.) exposed to steady and fluctuating Mar. Biol. U.K. Dethlefsen, V., Ass. 1977. brown shrimp Duinker, J.C. metals Bull. Engel, Uptake, Nolting, retention 1977. the Rhine Estuary M. Brouwer & F.P. american lobster. In: Calabrese &W . Advances. University D.W., W.G. F.J. Vernberg. Dissolved of J. cadmium by the 26: 137-1 52 . and particulate of Pollutants. 1971. Fowler, Vernberg. to In: 1981. F.J. Bight. trace - Mar. Poll. in Comparison of metal blue crab and the Thurberg, A. and Physiology: Press: Recent 229-245. Factors affecting organisms. Vernberg, New York: Cadmium poisoning 1225-1234. F.P. estuarine Biological Academic Press. Cyprinodontidae) and other 28: Vernberg, in South Carolina parameters. & W.B. 1985. protein Marine Pollution Sunda & B.A. Environmental Thurberg Can. and loss Thurberg, metal uptake and toxicity R., edulis - 8:65-71. D.W., Eisler, Mvtilus levels. Meeresforschung and the Southern metabolisme and metal-binding Engel, of sa lin ity 63-74. I Cranaon cranaon) . - & R.F. in 57: copper applied specimens A. Monitoring trace I. Calabrese, of F.P. Marine 127-144. Fundulus heteroclitus marine organisms. - J. Fish. (Pisces, Res. Bd. Fowler, S.W. flux & G. Benayoun, 1974. through marine biota. environmental Experimental In: contamination, studies Comparative pp. 159-179. on cadmium studies Vienna: of food and International Atomic Energy Agency. George, S.G. & T.L. Coombs, 1977. The effects the uptake and accumulation Biol. Goldberg, 39: J.D. of chelating cadmium by Mvtilus agents on e d u lis. - Mar. global marine 261-268. E.D., 1975. monitoring. Kinrade, of The Mussel - Mar. & J.C. Watch - A f i r s t Poll. Bull. 6: van Loon, 1974. Solvent flame atomic absorption step in 111. extraction spectrophotometry. - for Analyt. use with Chem. 45: 1894-1898. Kremling, Co, K. & D. Cu, Hydes, Mn and Ni Continental McLeese, D.W. & S. and zinc 32: Paus, Ray, P.E., 1972. 1977. trace D.W. D.A., R. Bull. B.M., - 26: Aust. K.D. growth in Cd, - of Environ. cadmium CdEDTA Contam. Toxicol. biological materials. biological & C.W. e d u lis. & H. - Environm. J. Mar. indicator Pollut. 1981. d iffic u lt ie s larvae. Mayor, spéciation. of In: 1985. Bull. 1982. - - 13: to 281-317. of copper, sediments Bull. by three Environ. Science S.H. The effect in 143: 679-688. 33: levels in Costlow. 1983. free on metallothionein and 53-54. of Trace metals copper in arising Advances New York: Mvtilus 491-506. (II) on survival, the common blue mussel Jenkins. Relationship Res. 222: the mussel heavy metal Effects rate 1972. Use of Sunda & J.D. sea water: interpretation in study. Freshwater 1972. Pergamon. water and those organisms Accumulation in monitoring W.G. in and heart Biol. research. E llio t, (Lamarck) B ilin sk i, Atomic in marine and estuarine A laboratory Jenkins, crab - 315-322. activity respiration V., of Peterson, Swain & N.G. ion Talbot, & M.R. planulatus cupric W . a review. Toxicol seawater. Stumm, Al, Is le s. 129-130. pollution invertebrates. edulis D.M. - 11: The use of metal McLuser Contam. Scott, Uptake and excretion cadmium and lead from two contaminated marine Sanders, 1984. dissoved 89-105. Bomb decomposition D.J.H., zinc, Ritz, 8: Newsletter environments S., Res. of around the B ritish 85-92. monitor Ray, Summer distribution surface waters by Macoma balthica. - Absorption P hillip s, Shelf 1988. in natural Mvtilus waters: from ignorance on water on their pollution 39-52. between cadmium concentrations the mussel Mvtilus e d u lis. - Mar. in sea Biol. 85: 51-54. Thompson, R.J. feeding Ecol. 9: Westernhagen, J. & B.L. in 1972. Active Mvtilus metabolism associated edulis (L.). - Mar. with J. Exp. Biol. G. Furstenberg 111-124. H. von, Klinckmann, experimental 31: Bayne, the mussel 471-484. V. Dethlefsen, 1978. marine H. Rosenthal, Fate and effects ecosystem. - of cadmium in Helgoländer Wiss. & an Meeresunters. Cadmium and copper and the average weights (g) of exposure experiment Mvtilus shell length (cm) the whole- body soft Length (cm) tissues Exp. Control ExDosed time Average Average (days ) (range ) (range ) 5.0 5.0 4.8-5.6 4.6-6.1 Control Cd çjtDosure 1 2 4 8 16 32 of 5.0 5.1 4.5-6.0 4.4-5.7 4.9 5.2 4.5-5.9 4.5-6.1 5.1 5.2 4.6-5.9 4.6-5.9 5.1 5.2 4.7-5.7 4.5-6.0 5.0 5.1 4.4-5.8 4.4-5.8 4.9 5.0 4.5-5.7 4.5-5.9 4.2 4.7 3.8-4.5 3.8-4.8 (g) ExDosed and dry 10 specimens. Pooled whole-body wet weight 0 e dulis: the range and the pooled wet- soft-tissues dry weight Control (g) Exposed experiment 48.1 50. 4 8.28 9.21 42.3 45.8 7.30 8. 49 42.9 53.7 7.41 9.45 44 .0 46.6 7.77 7.58 48. 4 47.3 8.75 8.00 43. 1 46.8 7.13 8.43 49 . 2 47.6 8. 46 8. 23 £ll ejtposure experiment 0 1 2 4 8 16 32 4.8 4.7 4.6-5.0 4.3-5.1 4.8 5.0 4.4-5.3 4.5-5.5 4.9 4.7 4.6-5.3 4.4-5.4 4.9 4.9 4.6-5.2 4.3-5.4 4.9 5.1 4.6-5.1 4.3-5.3 4.6 4.5 4.1-5.4 4.0-5.1 39.0 42.8 4.50 5.04 48.5 41 .6 5. 43 4.44 44.7 47.5 4. 20 5.37 39.4 40.4 4.32 4.31 34.1 33.9 3.86 3.98 34 . 1 35.1 3.58 3.79 37.4 39.3 3.61 3.90 Table 2. Cadmium exposure the average shell weights of (g) experiment length whole-body Length Cerastoderma edule: the range (cm) (cm) and the pooled wet- soft tissues of Exp. Control Exposed time Average Average (range ) (range ) 1.6 1.6 1.2-1.9 1.3-2.2 1.6 1.5 1.3-2.0 1.3-2.2 0 1 2 4 8 16 32 1.5 1.5 1.3-1.7 1.3-2.0 1.6 1. 4 1.4-1.9 1.2-1.6 1. 4 1. 4 1.1-1.7 1.1-1.7 1.5 1.5 1.2-1.7 1.2-1.8 1. 4 1. 4 1.2-1.8 1.1-1.8 20 specimens. Pooled whole-body wet weight Control and and dry (g) ExDosed soft-tissues dry weight Control (g) Exposed 7.32 7. 79 0.57 0 .63 6.37 5.72 0.49 0.52 6.84 7. 46 0.45 0.49 6.34 8.11 0.54 0.39 6.48 7.17 0.35 0.34 6.29 5.05 0.34 0. 29 6.21 4.91 0.35 0.21 Table 3. Cadmium exposure average length experiment Macoma balthica: the range and the (cm) whole-body soft and the pooled wet- tissues Length of (cm) Controi ExDOsed time Average Average (range) (range ) 0 1 2 4 8 16 32 2.1 2.1 1.9-2.5 1.7-2.3 2.0 2.0 1.6-2.4 1.6-2.4 2.0 2.0 1.6-2.4 1.8-2.2 2.0 2.0 1.7-2.3 1.8-2.2 2.0 1.9 1.6-2.2 1.6-2.3 2.0 2.0 1.7-2.3 1.6-2.5 2.1 1.9 1.7-2.2 1.6-2.2 of Pooled whole-body soft-tissues wet weight Exp. and dry weights 20 specimens. Control (g) ExDosed dry weight Control (g) ExDosed 14.5 14.7 2.27 2.22 13.2 12.7 1.86 1.75 14.0 14.2 1.96 2.21 13.4 12.6 1.81 1.64 14.1 14.8 1.85 2.13 13.3 14.0 1.65 2.01 14.3 13.0 1.88 1. 72 Cadmium and copper wet- exposure and dry weights specimens exposure pooled; I (g) of and I I experiment Cranaon cranaon: the the whole-body tissues refer to two separate of 10 cadmium experiments. Pooled whole -body Exp. time wet w eight Control (days) (g ) dry w eight Ççntççl Exposed (g) ExDosed Cd exposure experiment I / II I / II I / II I / II 0 25.3 -- 21.5 _ _ 5.82 / 2. 23 1 24.3 -- 22.0 -- 5.25 / 1.96 4.96 2 24.6 -- 23.5 -- 5. 43 5.39 4 24.8 -- 23.6 -- 4.99 2. 02 5.47 8 26.2 -- 25.1 -- 5.58 / / / 2. 14 2. 30 5. 46 / / / / 16 24.2 -- 23.9 -- 5.97 / 2. 08 5.32 / 2. 12 24 19.9 -- 12.9 -- 4.19 / 1.89 3.80 / 1.99 5. 28 / 2.08 Cu exposui:e experiment 0 6.62 6.66 2.45 2. 17 1 6.09 7.32 2.02 2. 23 2 5.85 6.43 2.14 1.99 4 5.87 6.53 1.84 2. 12 8 5. 76 7.08 2.00 2.17 16 6.66 6.35 2 . 40 2.30 24 5.74 4. 48 1.95 1.80 2. 17 2.30 1.93 2.21 NIOZ - RAPPORT 1990 - 8 CONTENTS 1 1. Introduction ................................................................................................................................................ 3 2. Materials and methods .............................................................................................................................. 4 3. Results .......................................... 3.1. Cadmium uptake experiments 3.2. Copper uptake experiments . (0 0)0) Summary ........................................................................................................................................................ 4. Discussion .................................................................................................................................................. 13 5. References .................................................................................................................................................. 18 Printed by ARTIGRAFICA Den Helder
